Dashboard
The Dashboard is designed to give users a quick view into project status and bench status with customizable reporting widgets that can be adapted to each users needs. Below we will review the key modules in the Dashboard and their use.
Dashboard Modules
The dashboard has a wide array of analytical modules that provide a holistic view point for the projects, people, and rates under a company's purview. This is done through a variety of modules, which highlight key utilization indicators.
Projects Overview
The Projects Overview module provides a mechanism to view the status, remaining length, and allocation availability for all the projects in your hierarchy.
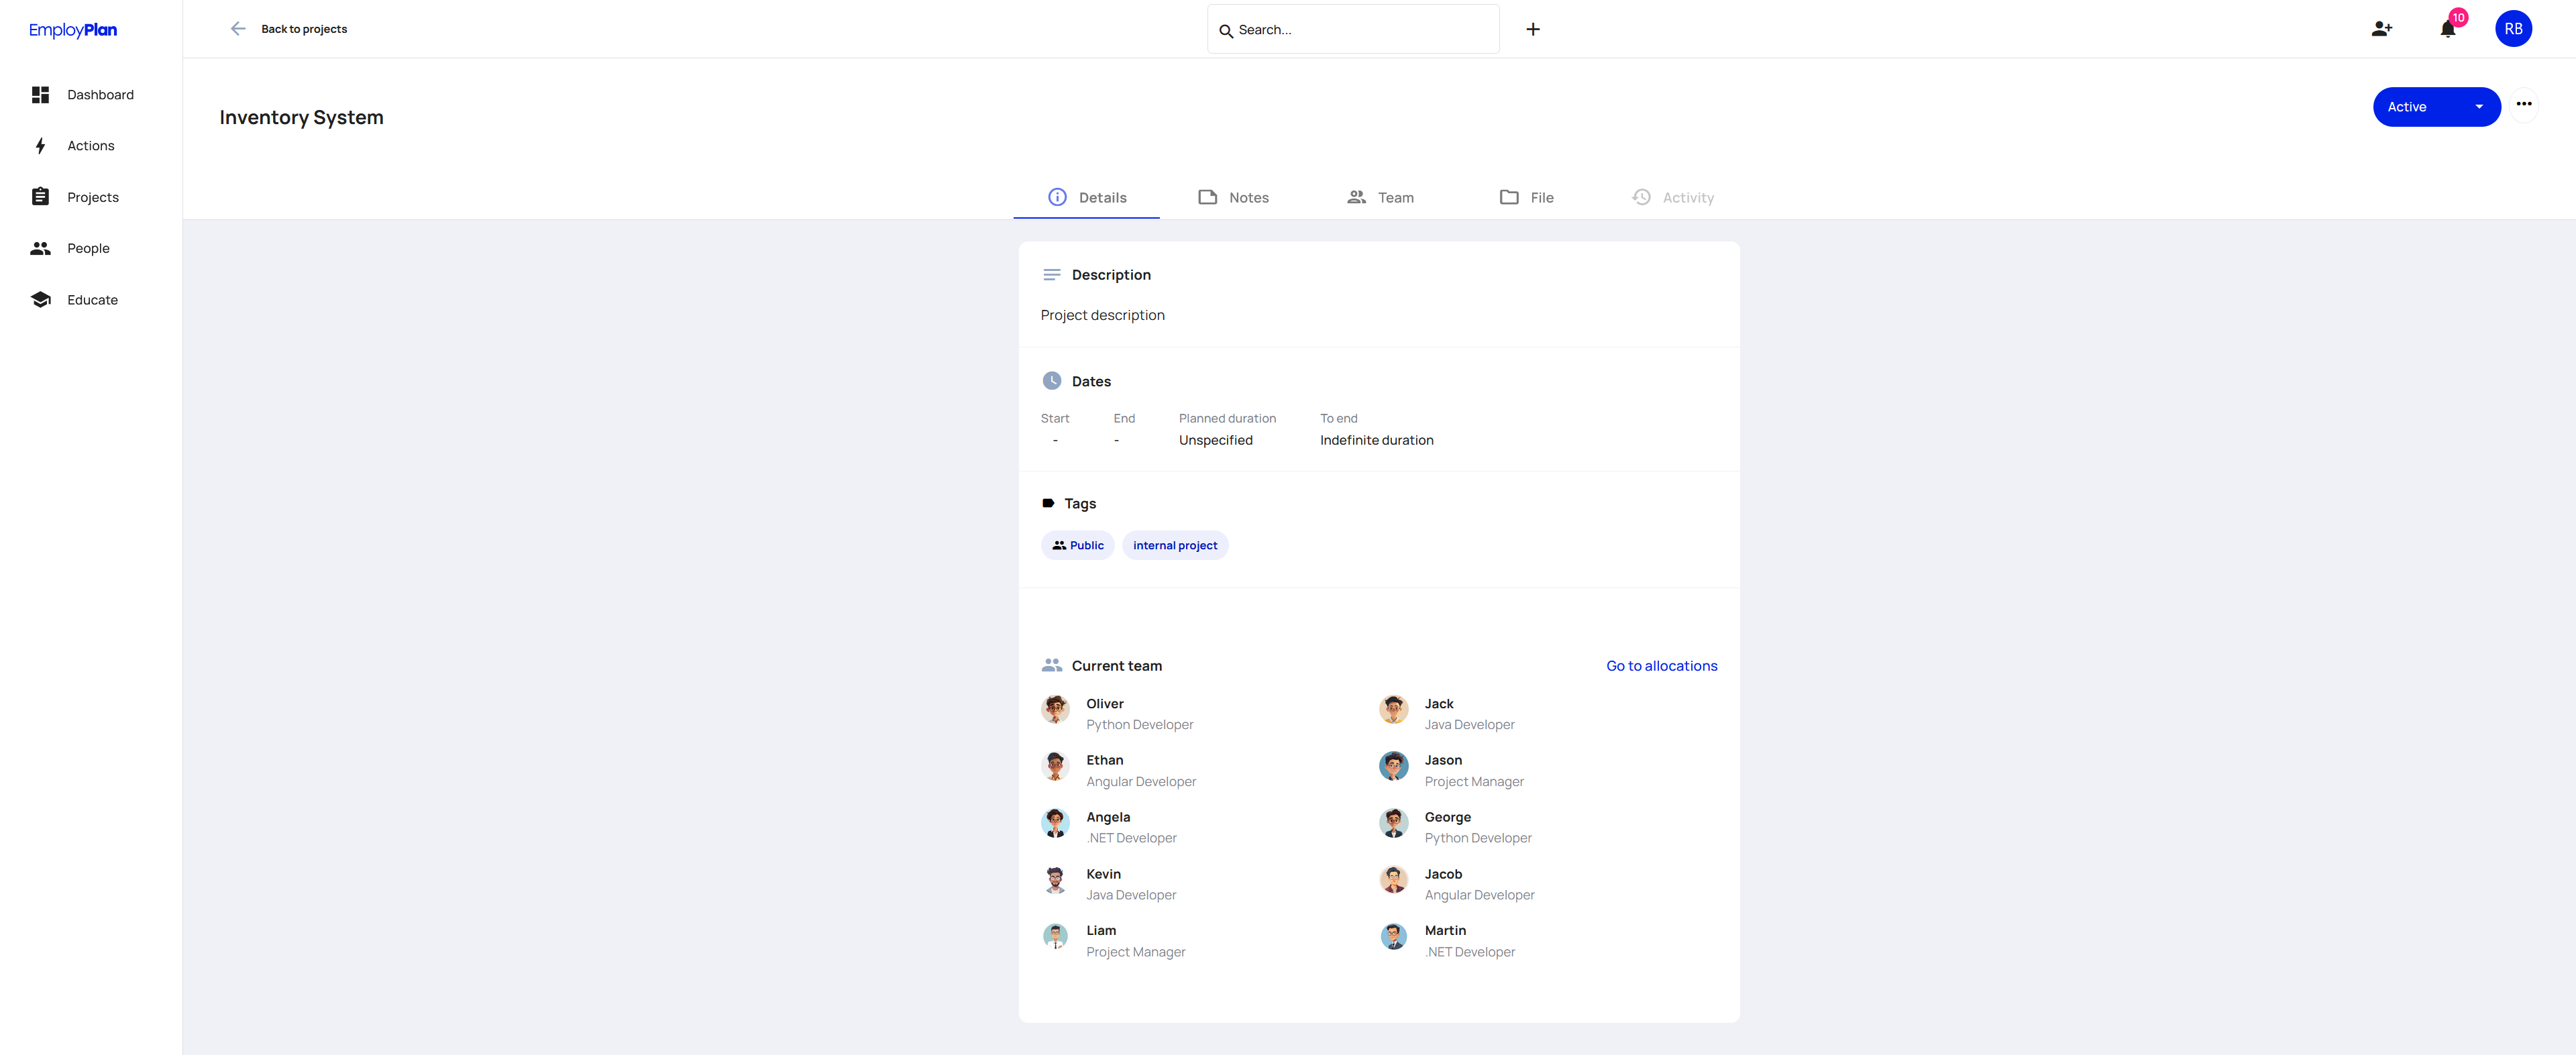
Selecting a project from the list will navigate you to that project's homepage, where details, notes, team and file information can be found.
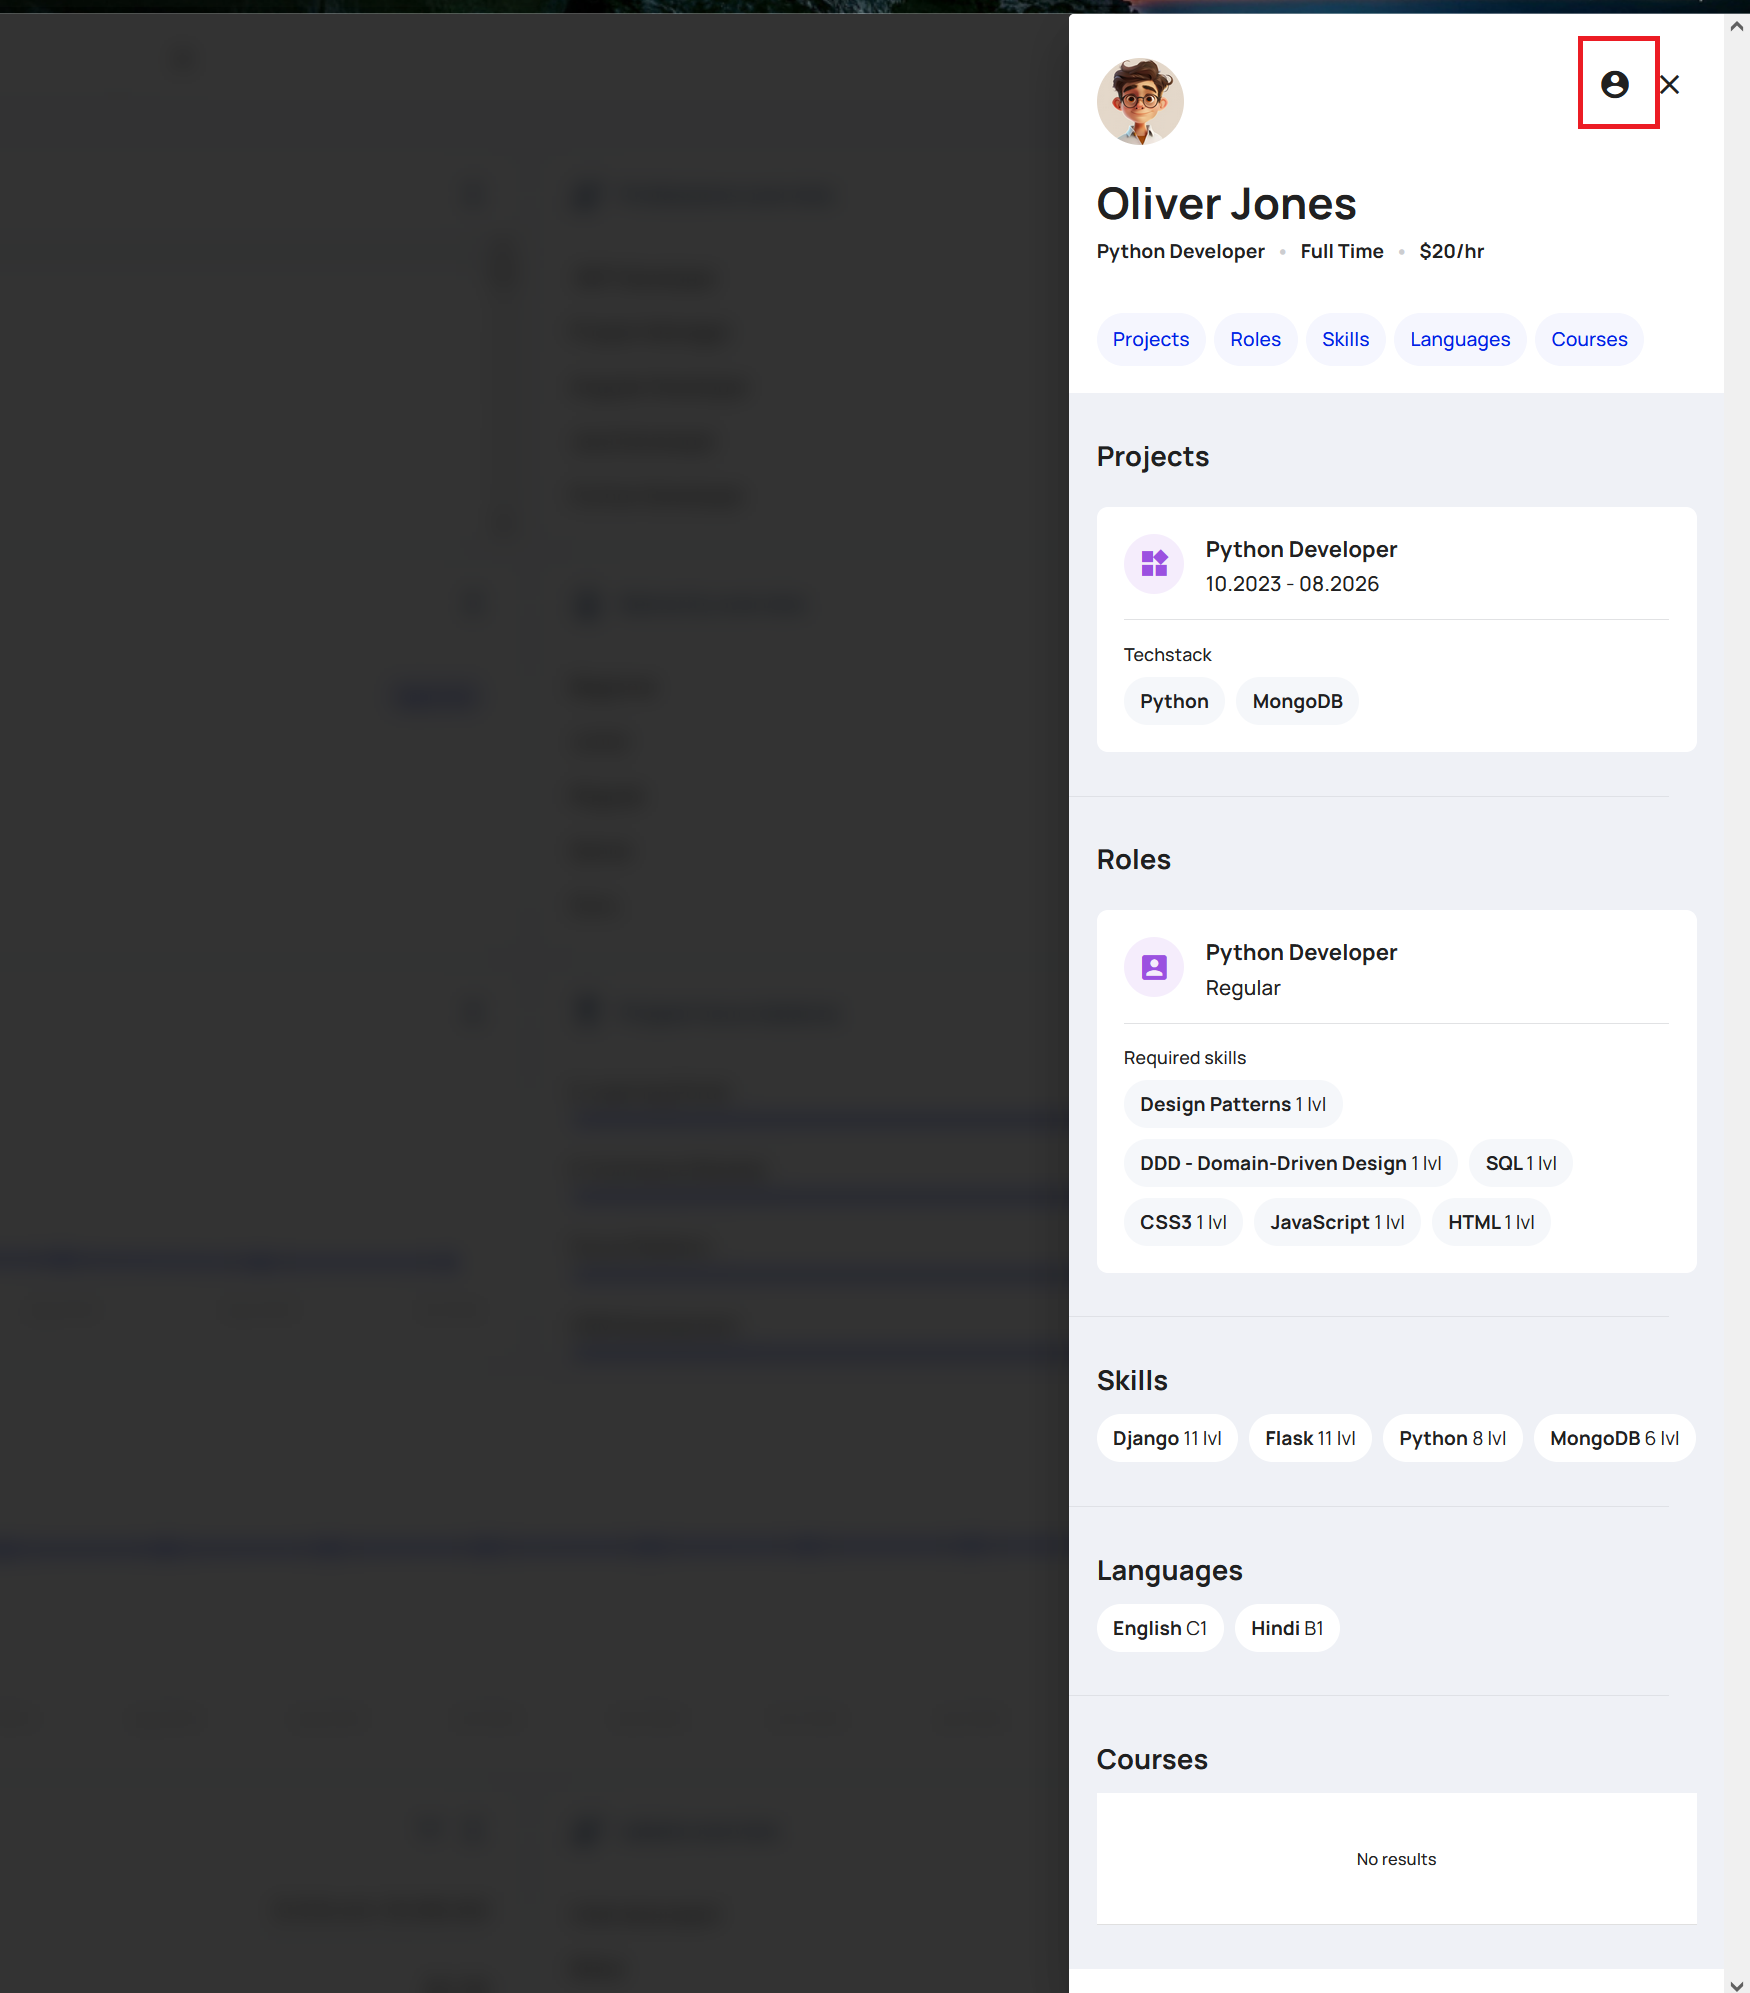
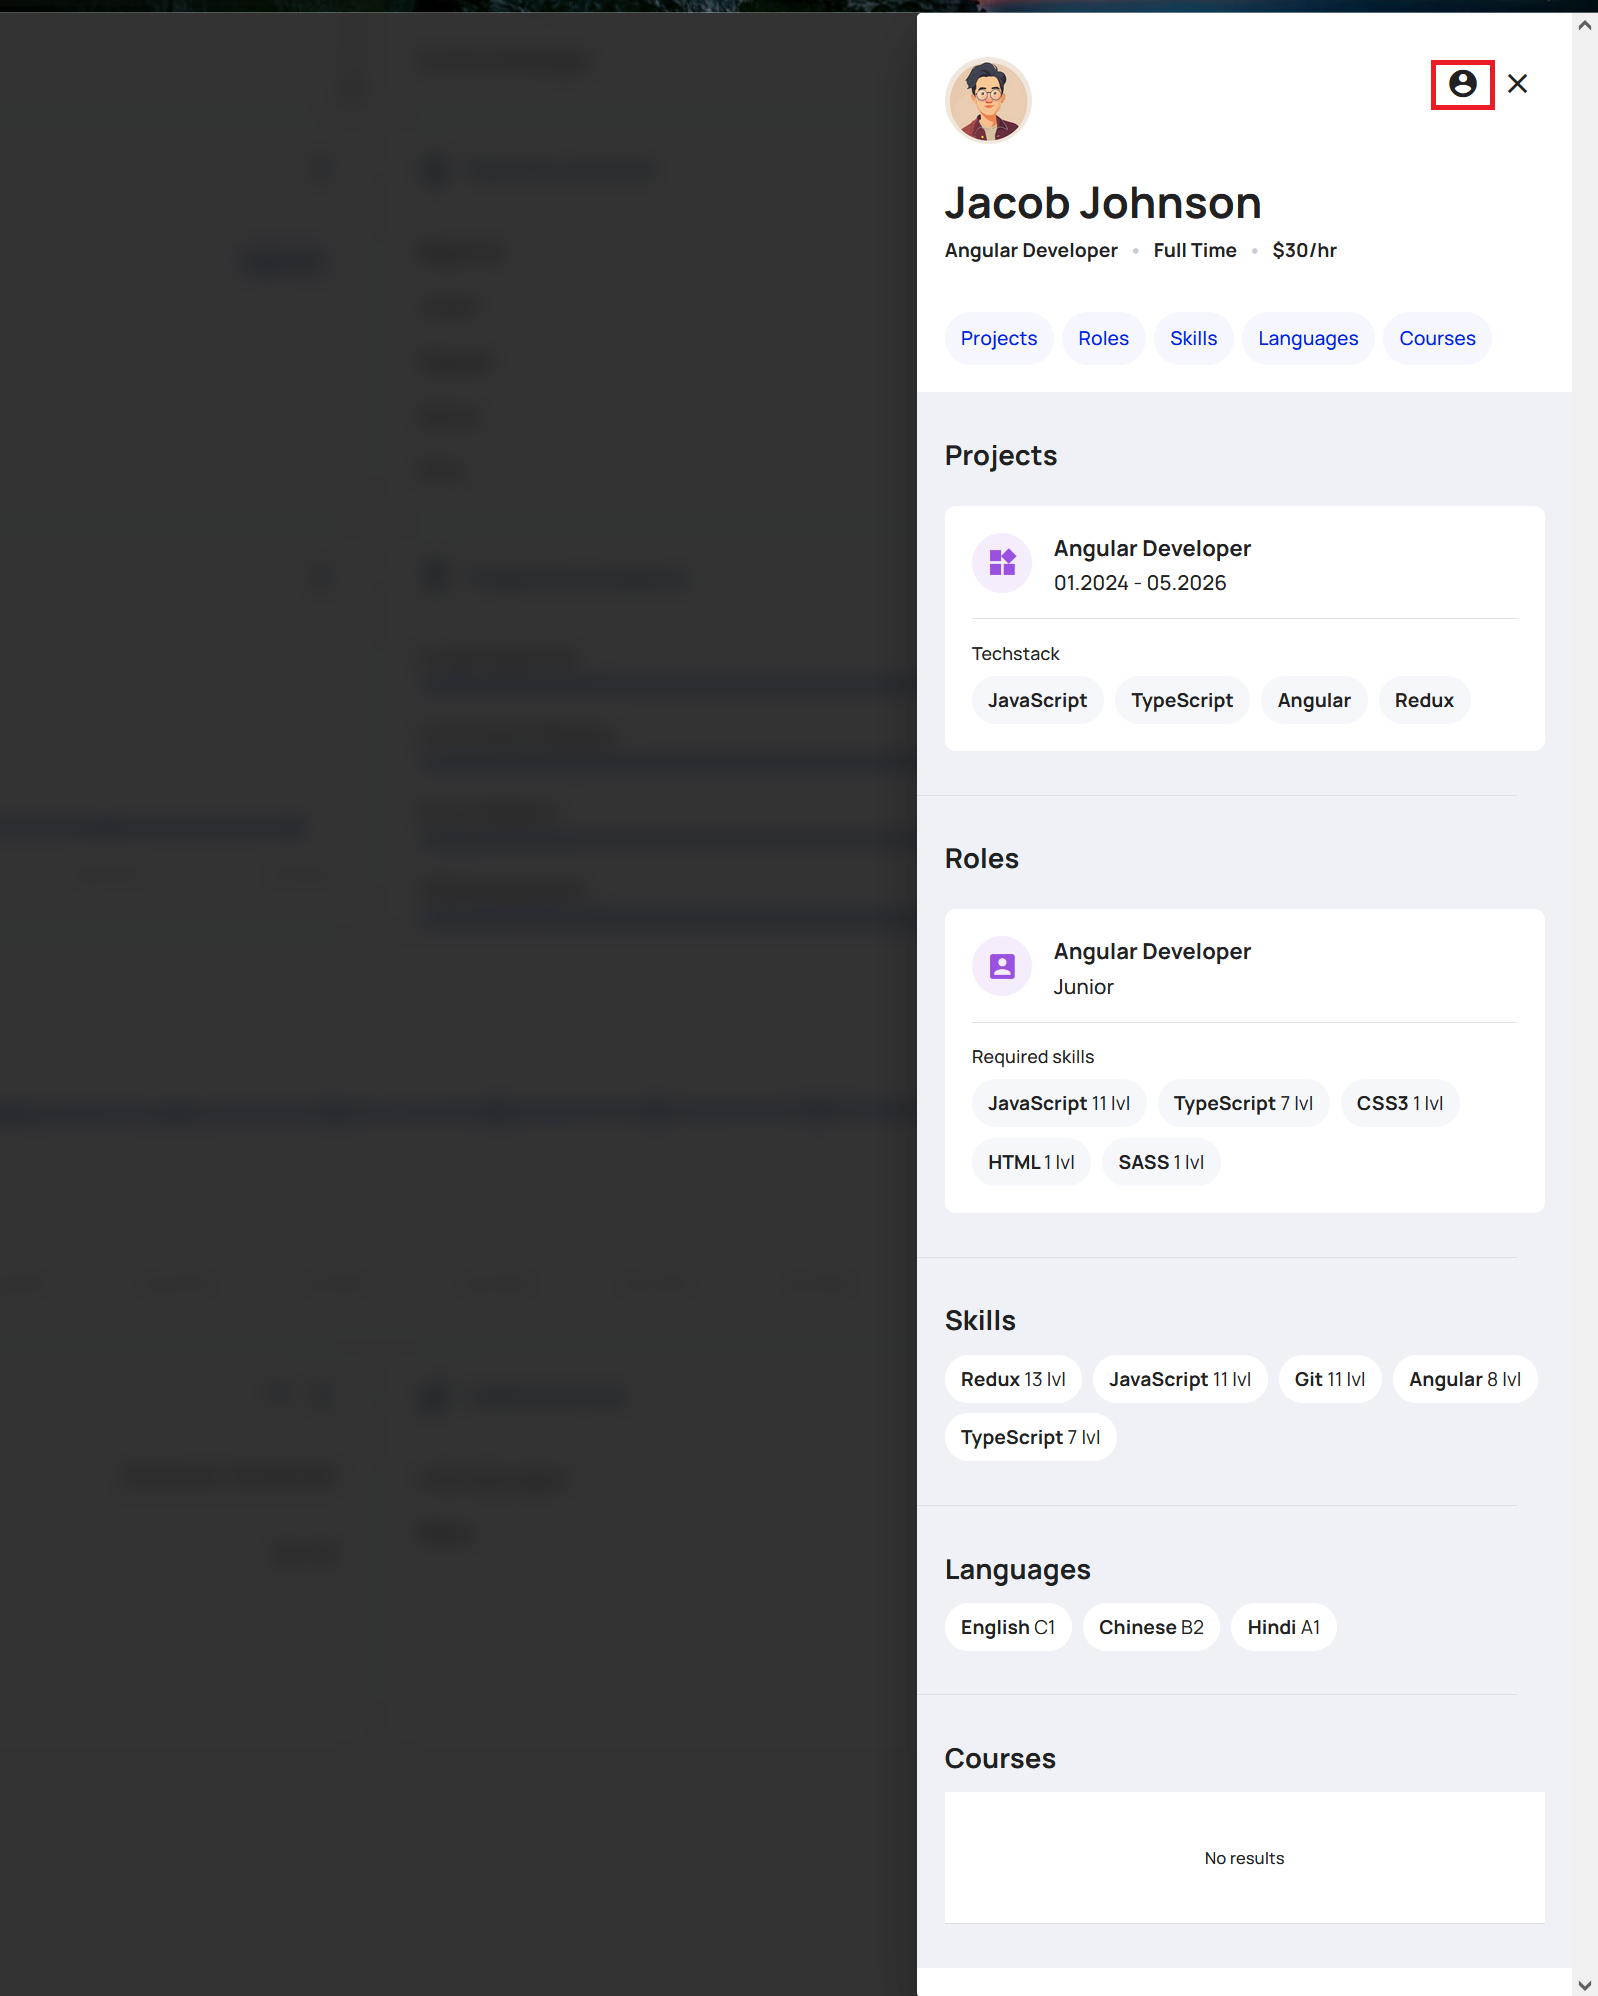
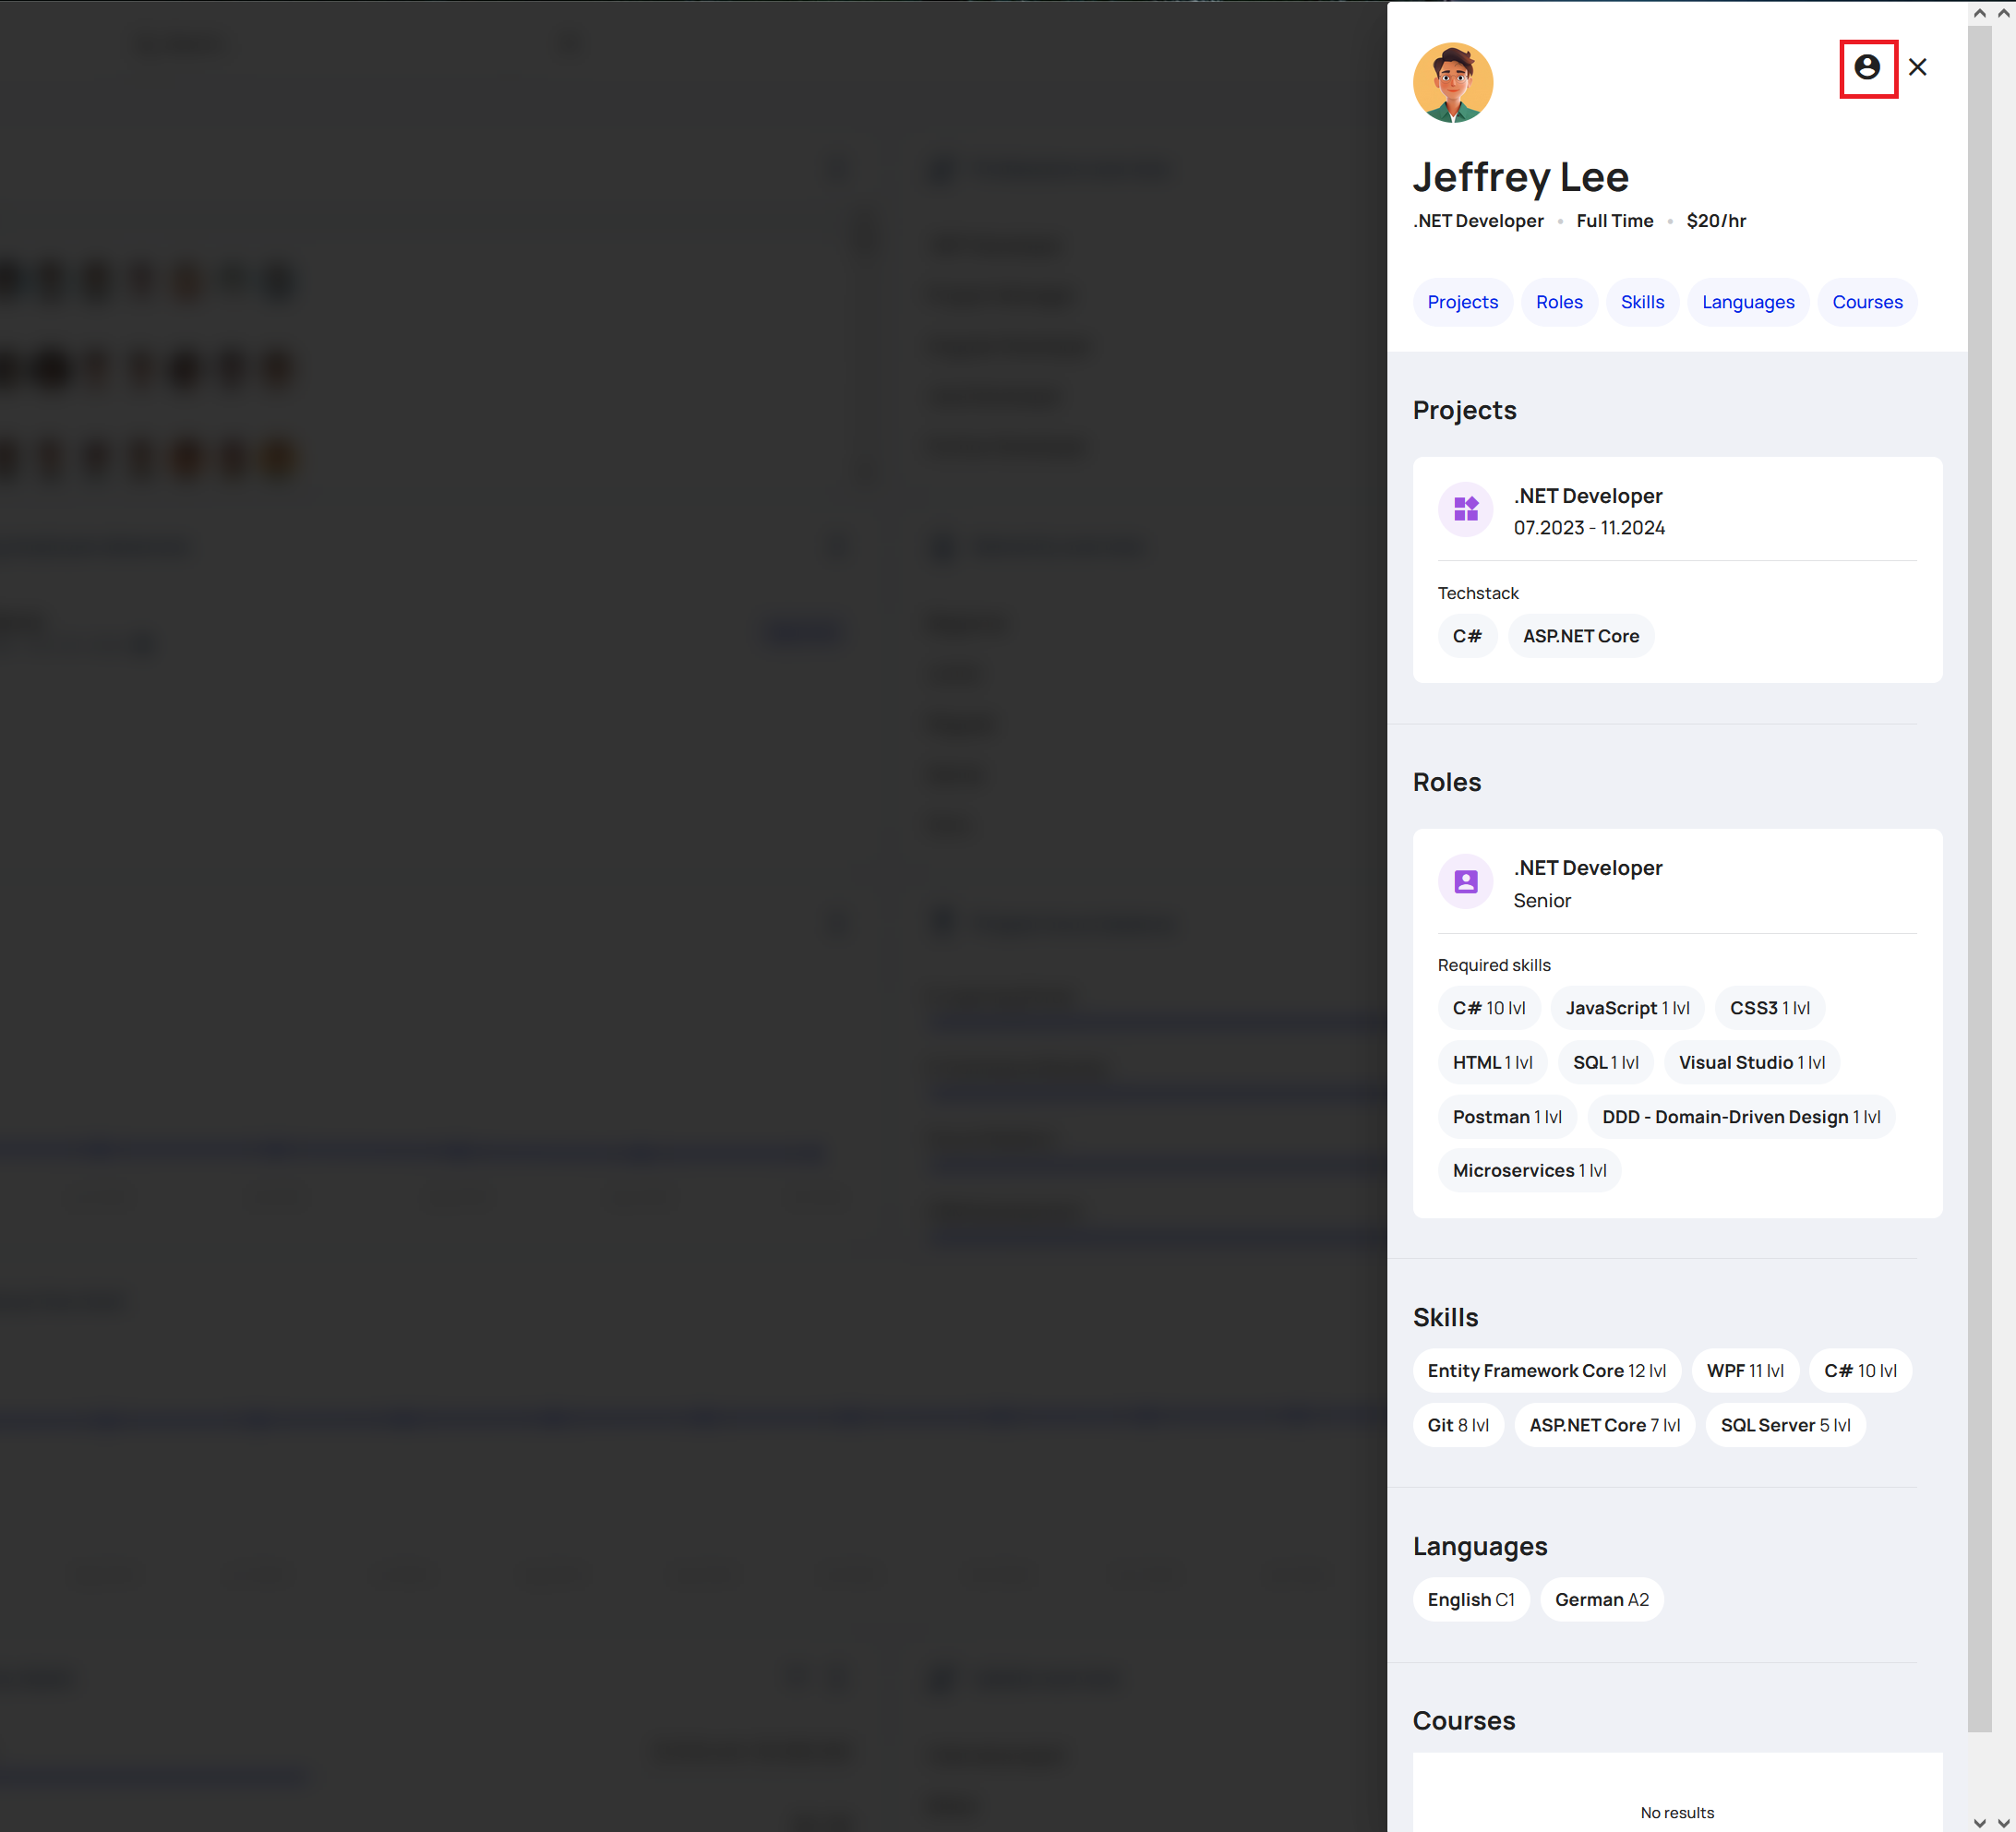
Selecting a user's icon from the Projects Overview module will open a user preview pop-out window on the right side of the browser.
The full profile can be navigated to by selecting the Profile Icon in the top right corner.
Professions Overview
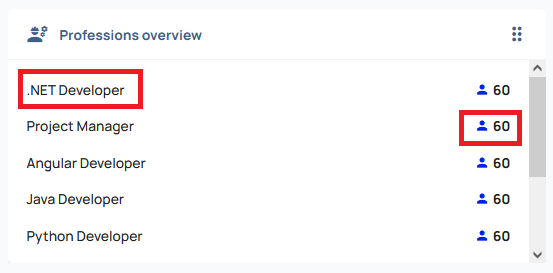
The Professions Overview module provides an interrogatable framework for both the types of professions being utilized and the amount of users that match each of those professions.
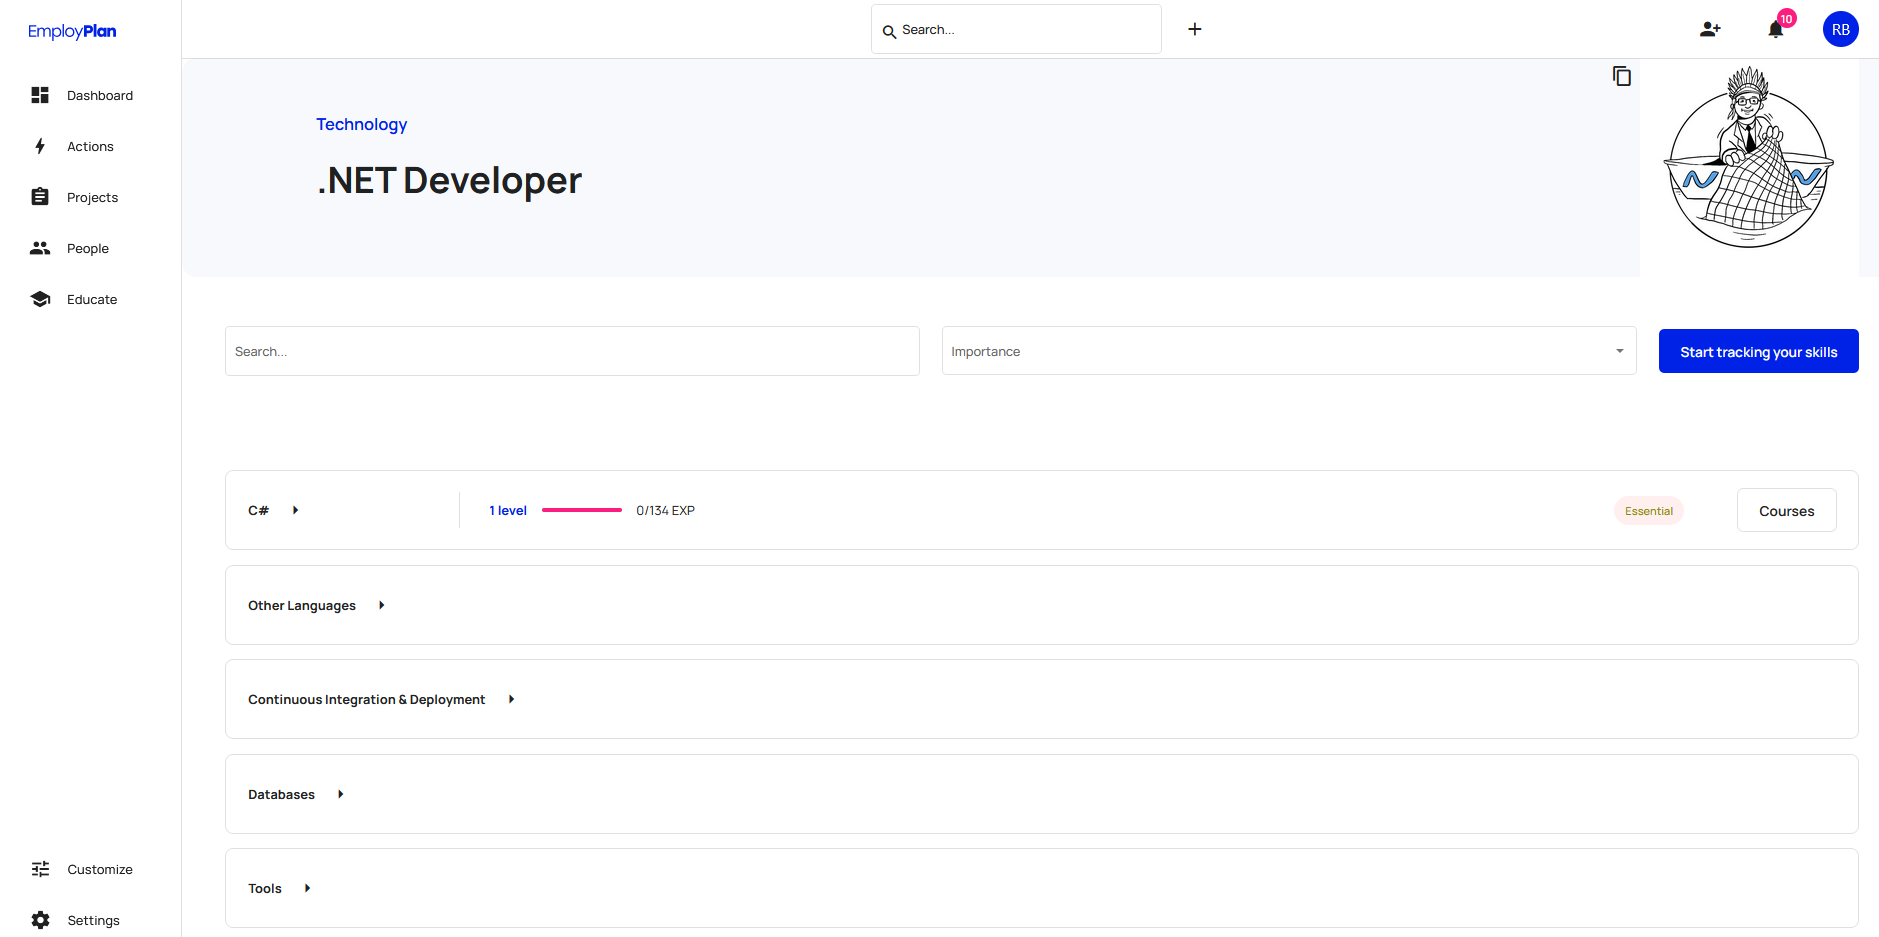
Selecting the profession from the left side list of the module will open the selected profession's page, allowing you to see the requirements needed to be considered qualified in that profession.
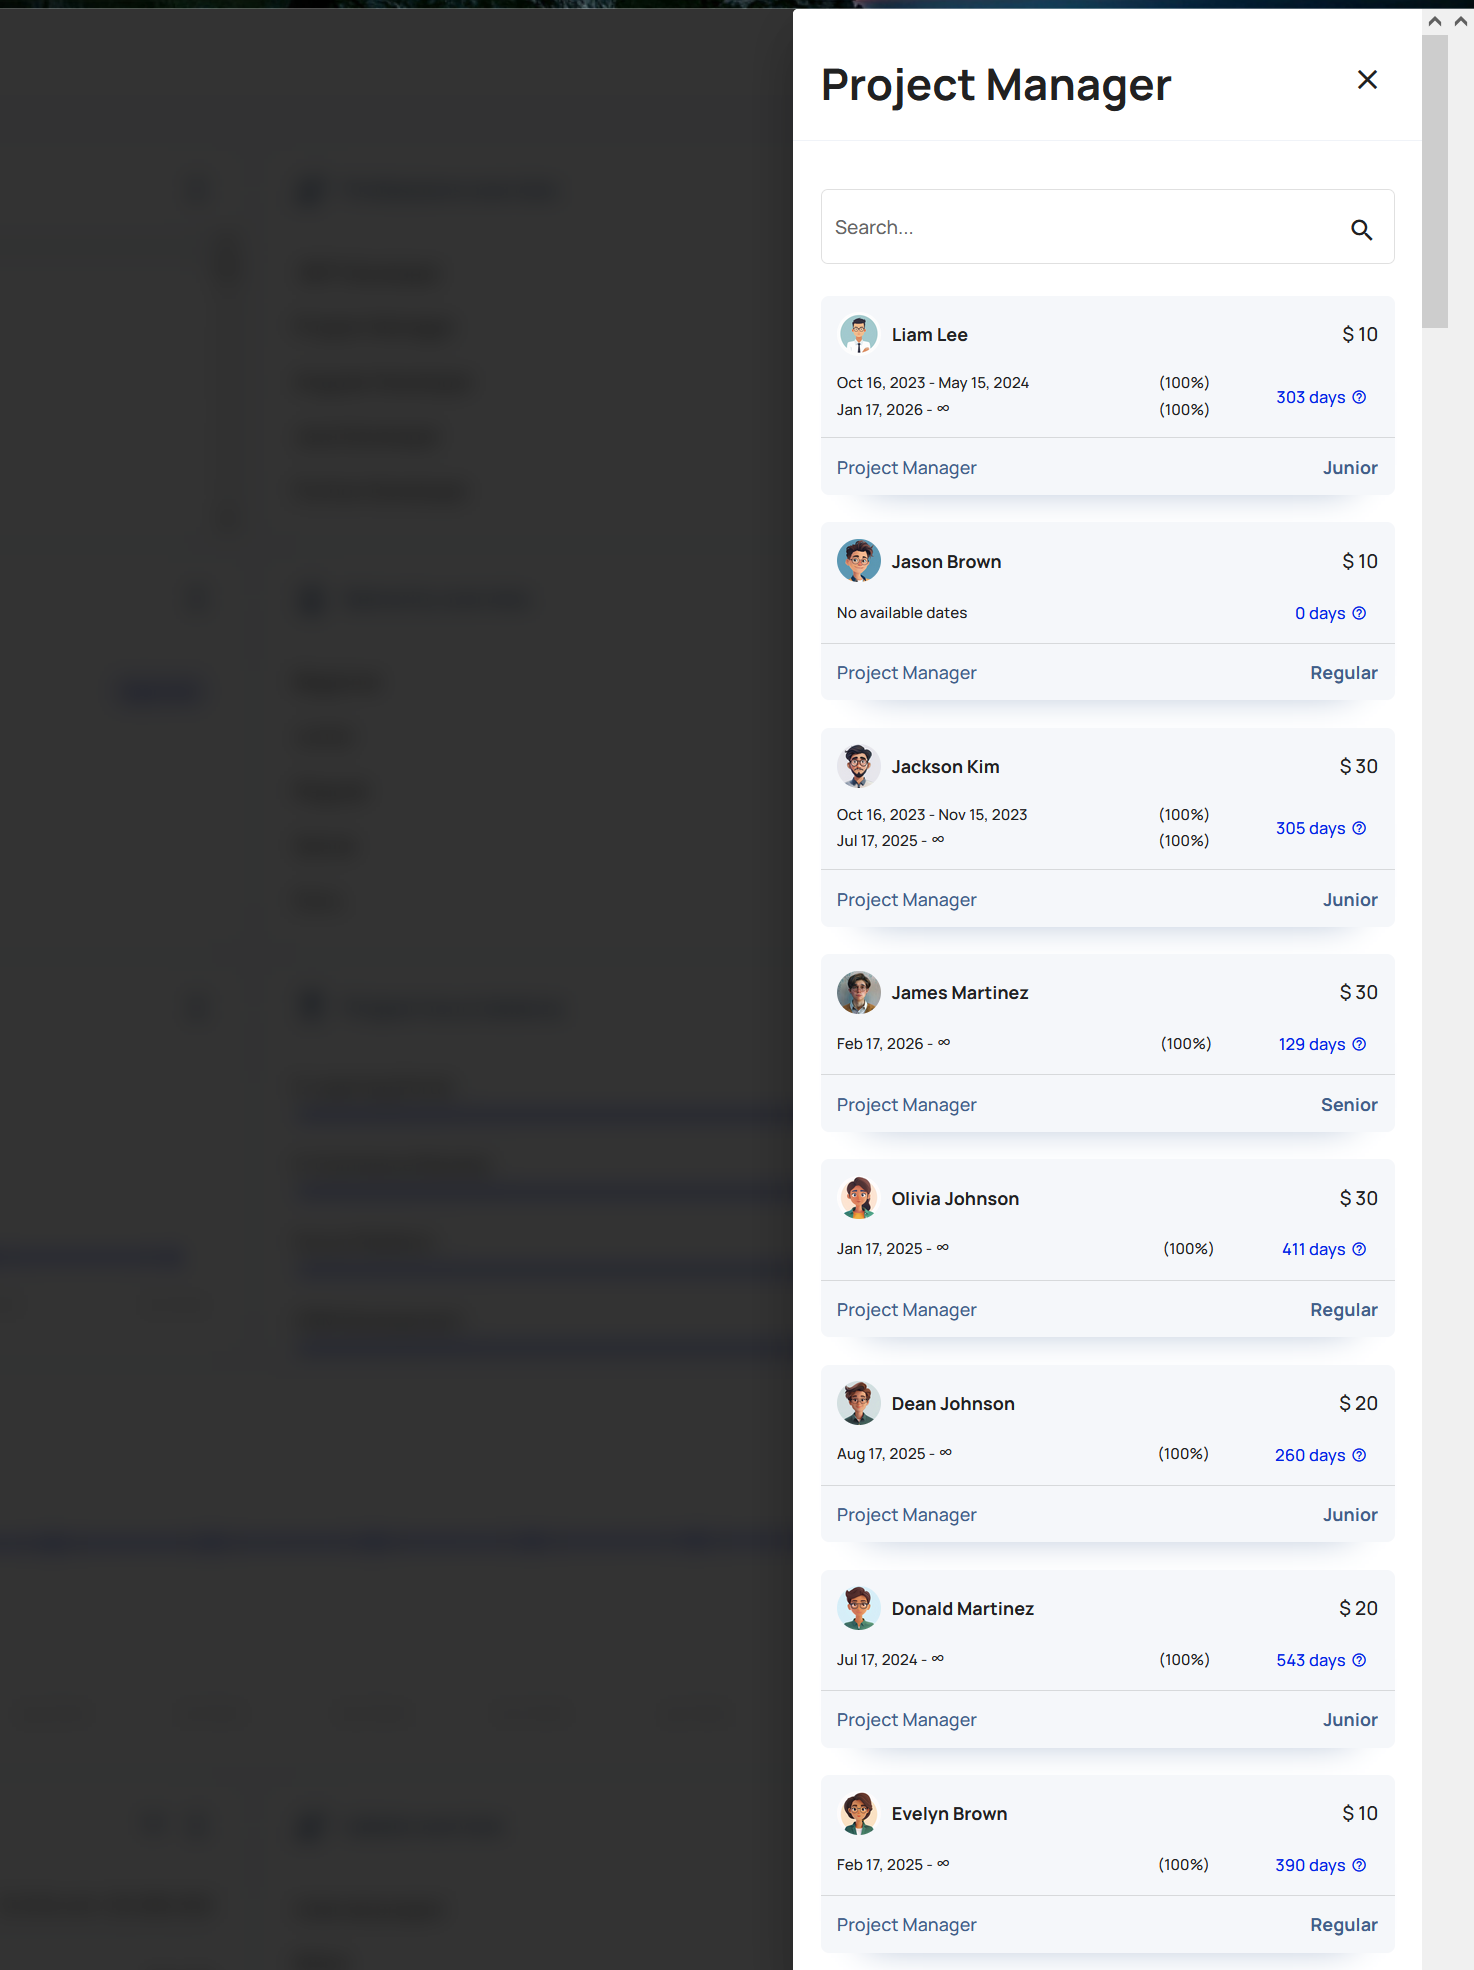
Selecting the team size in the professions overview module opens a preview window on the right side of the screen with a searchable list of all available people qualified for that profession, with their profession level, allocation windows, and rates visible.
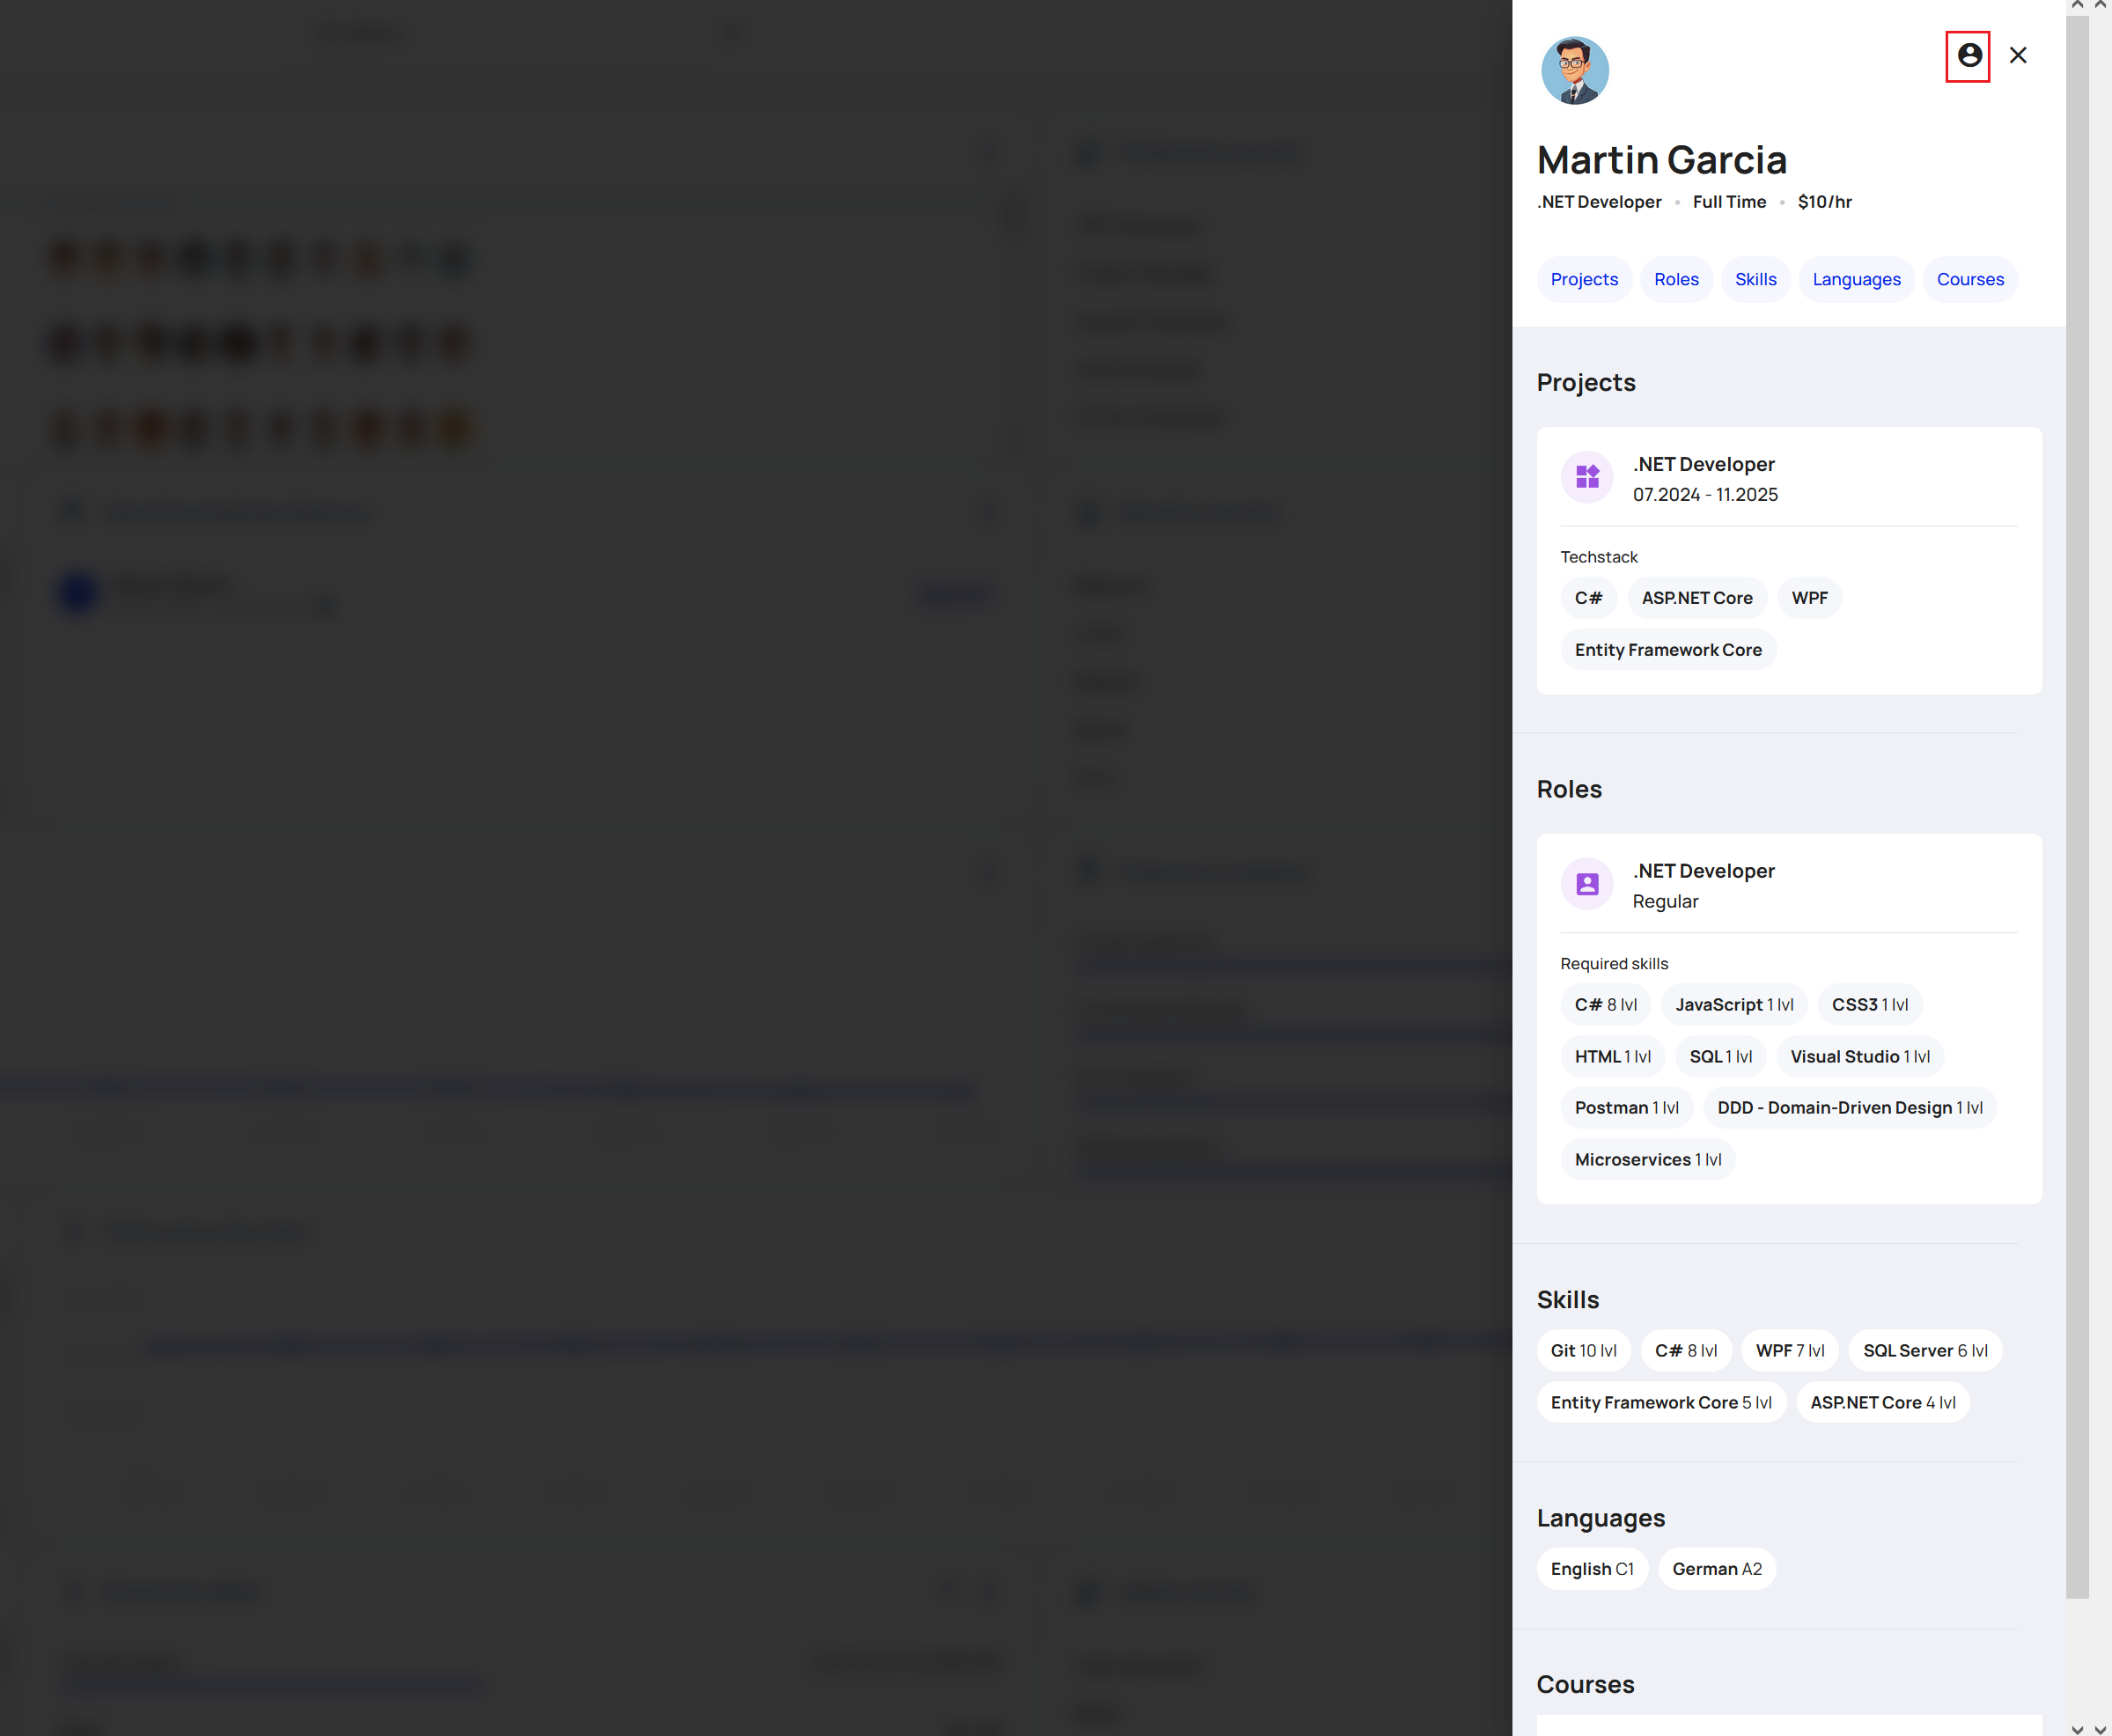
Selecting a user from this list will overlay the right-side pop-up window of the employee profile preview window.
The full profile can be navigated to by selecting the Profile Icon in the top right corner.
Seniority Overview
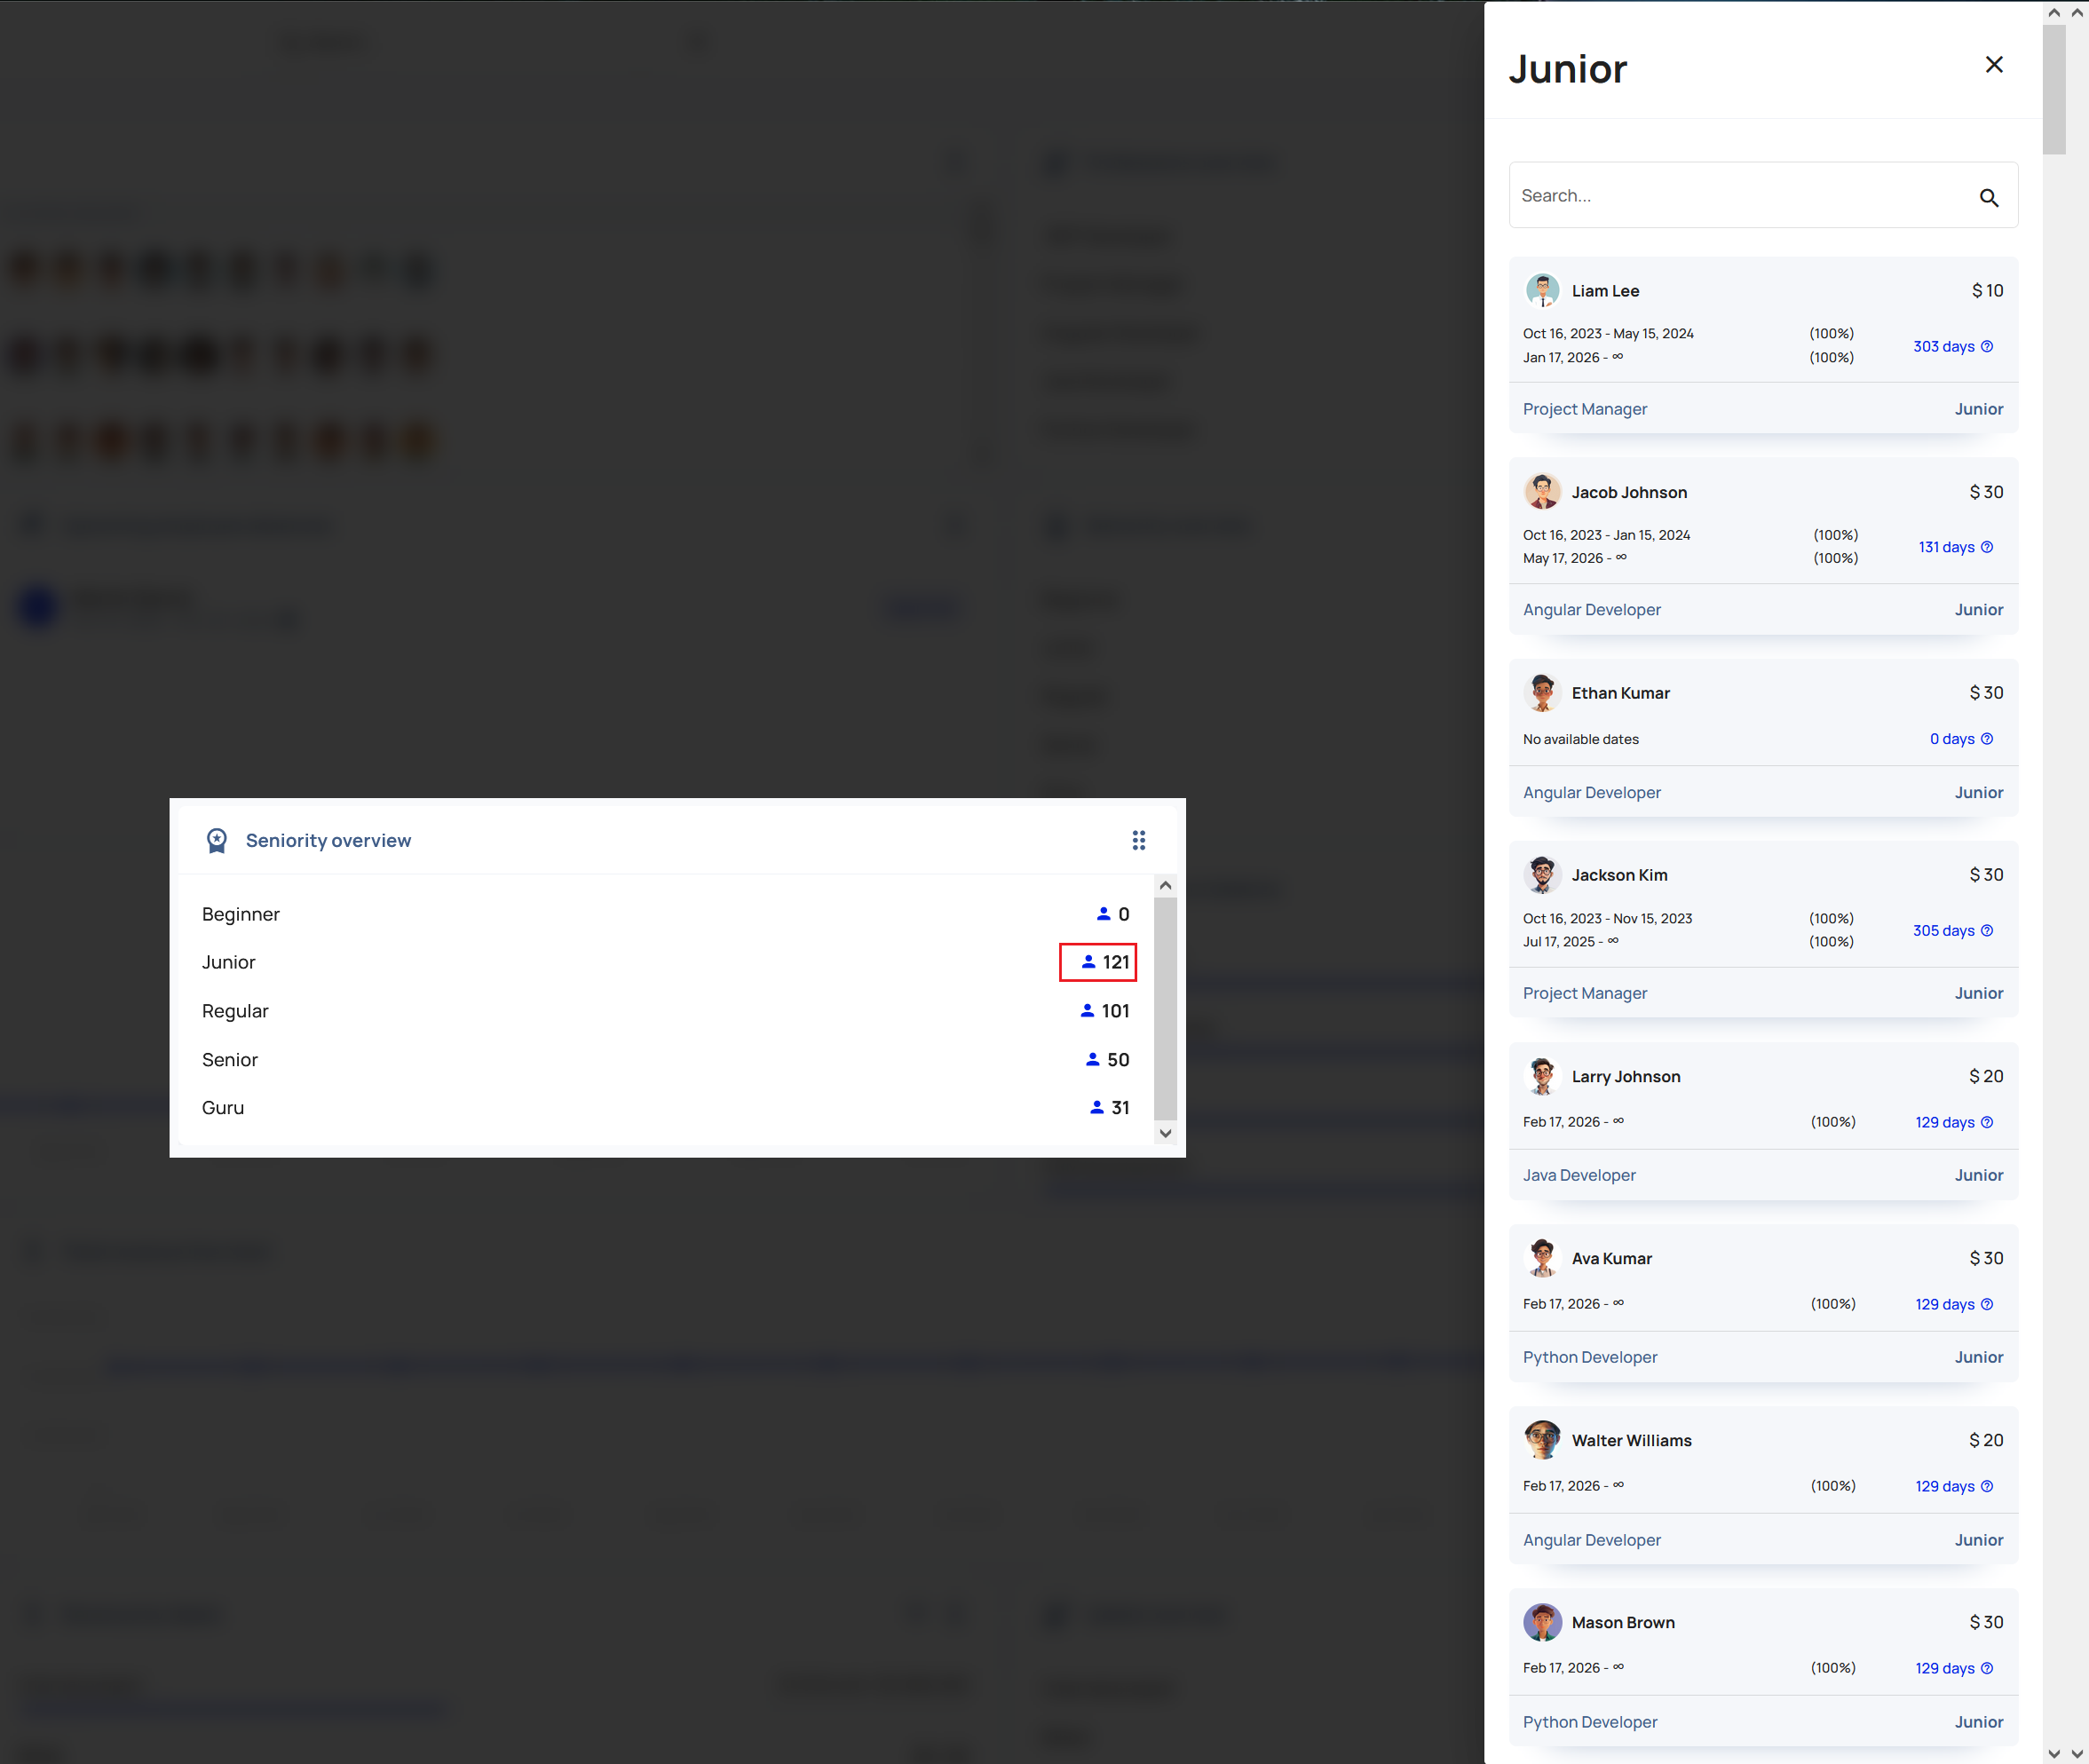
The Seniority Overview module provides a numerical breakdown grouped by skill level of the people that exist in the available hierarchy. Due to the fact that skill levels have distinct and dynamic requirements, and can vary significantly depending on the profession, drill-down navigation for this module is constrained to showing the profiles at the skill level.
By selecting a skill group's number, a searchable pop-out window will appear on the right side of the browser, providing a dynamic list of the People at that skill level currently, their profession, project allocations (and %FTE), and hourly rate.
People Available Within 30 Days
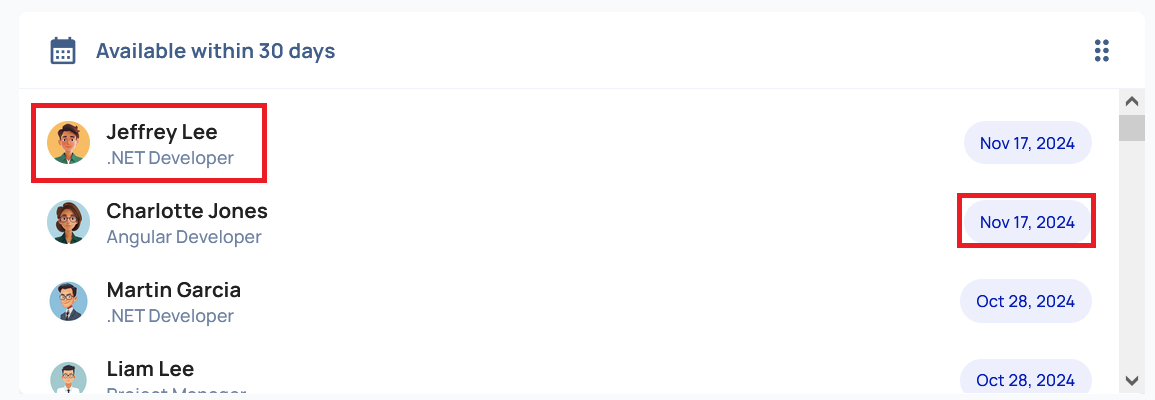
The People Available Within 30 days module shows upcoming availability of people sorted by date.
Selecting a user's profile from the list will expand a pop-out window from the right side that is a profile preview for that user.
The full profile can be navigated to by selecting the Profile Icon in the top right corner.
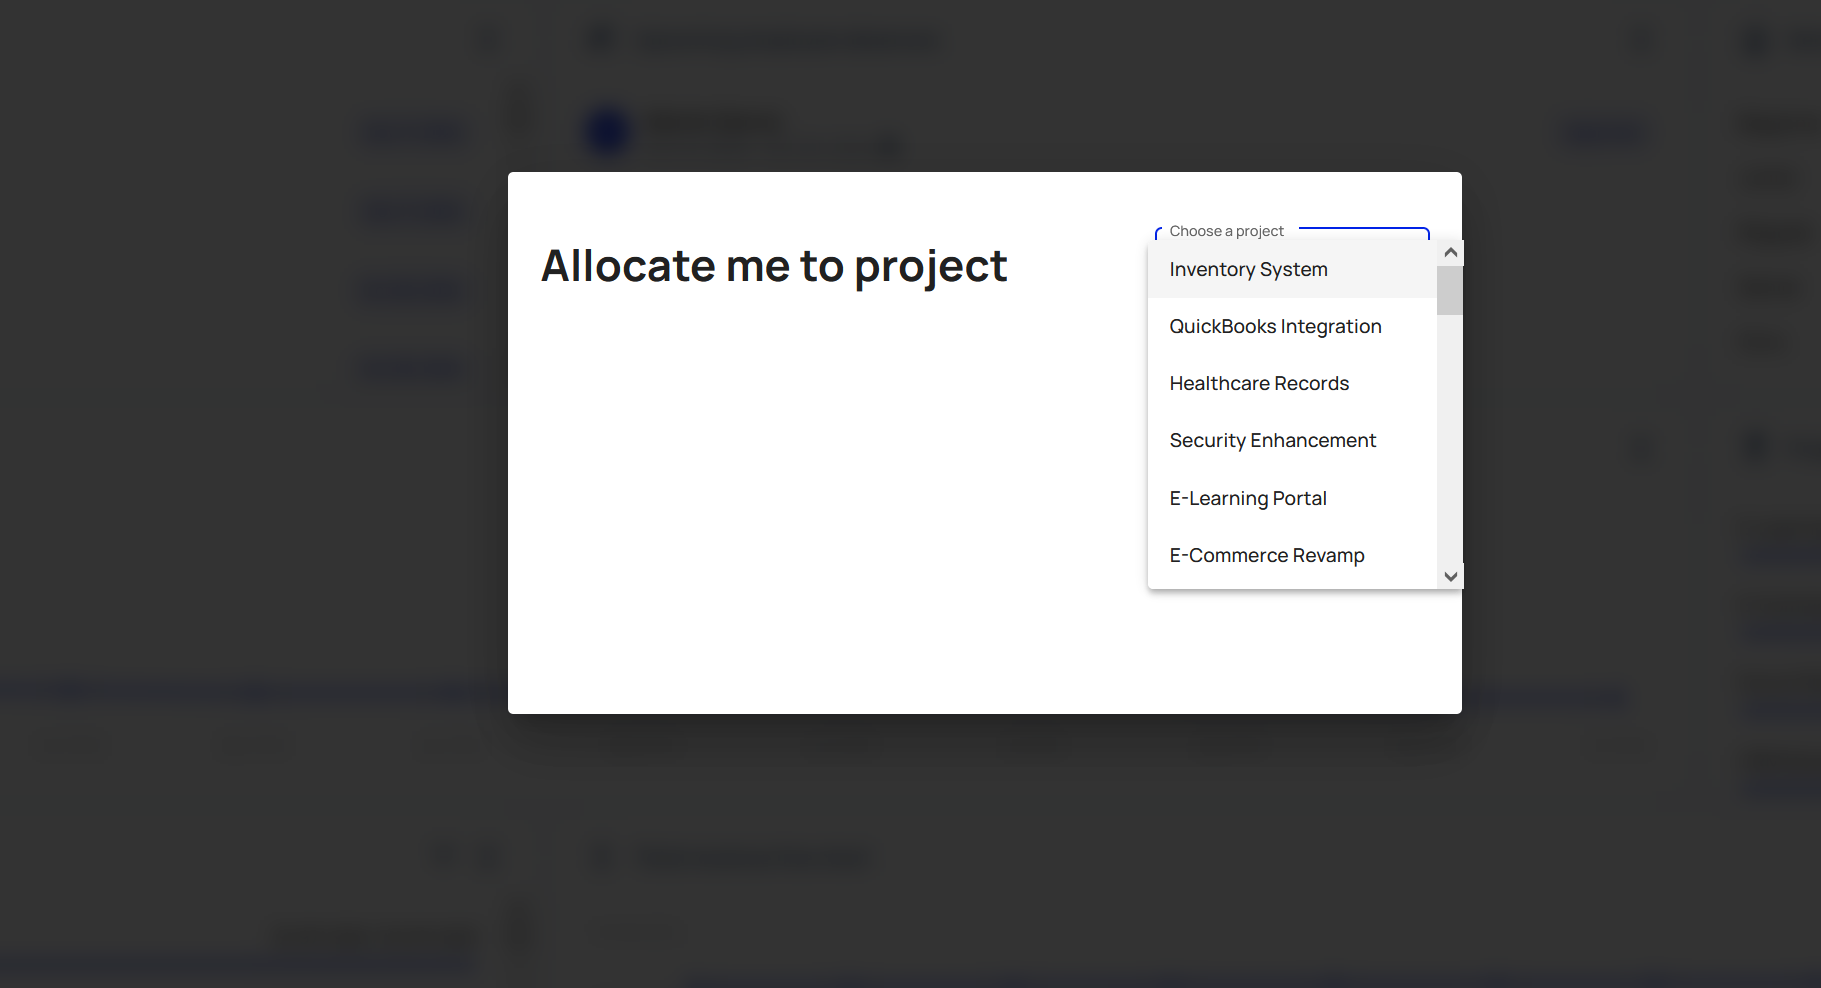
Selecting the date for a profile's row will open an allocation window for that user, allowing you to allocate them to a project.
Upcoming Employee Absences
The module for Upcoming Employee Absences shows the name, window of absence, absence type (which can be seen by hovering over the icon next to the date range) and absence request approval status.
Selecting a user's profile from the list will expand a pop-out window from the right side that is a profile preview for that user.
The full profile can be navigated to by selecting the Profile Icon in the top right corner.
Utilization Rate
The module showing utilization rate is a timeline representation of total employee utilization percentage (%) segmented by month.
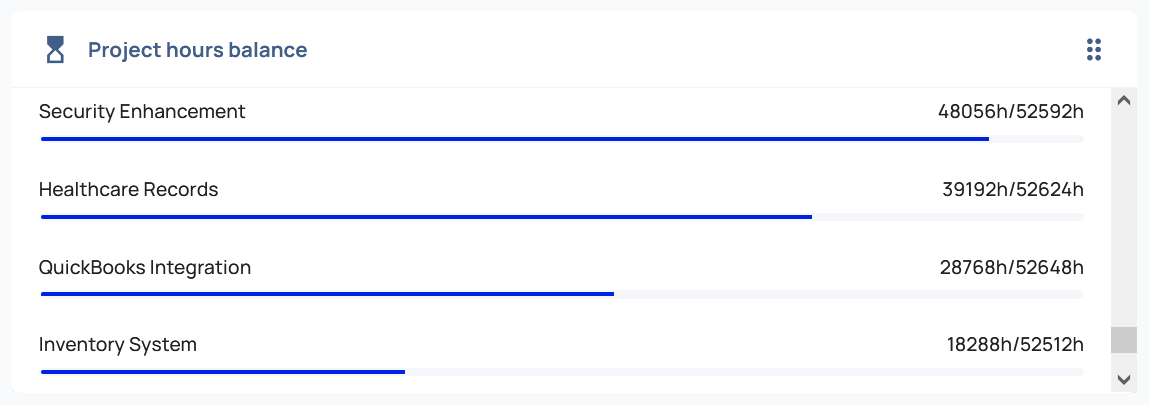
Project Hours Balance
The balance of hours for projects is presented in this module, organized by completeness.
Total Project Revenue
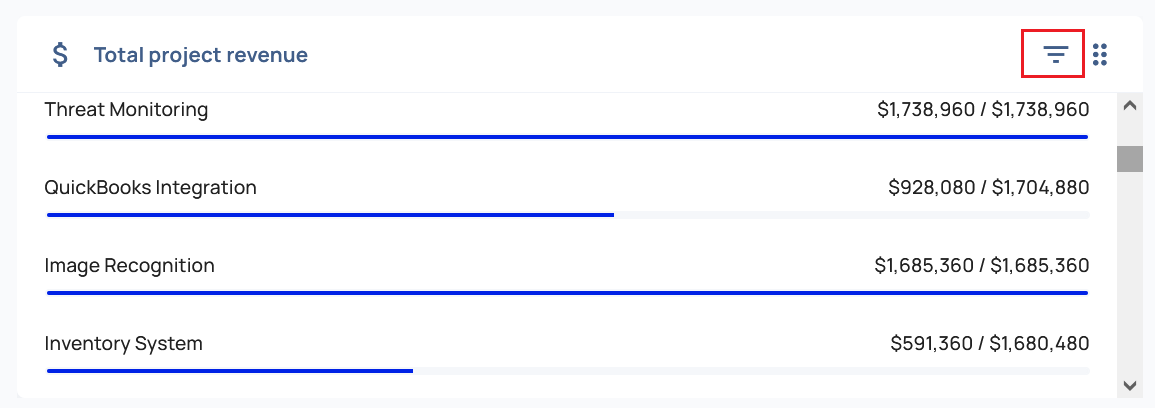
Each Project's total revenue is visibile in this filterable module, which is sorted on value.
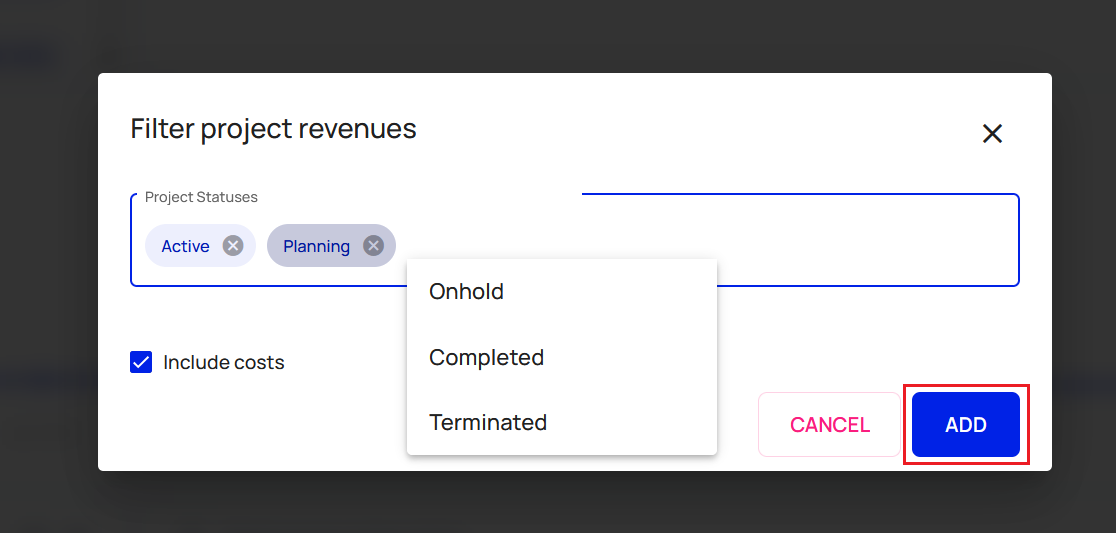
These projects can be filtered by selecting the Filter Icon, which will open the Filter Project Revenues pop-up window.
Selecting status(es) and selecting the Add button will dynamically change the projects shown in the module.
Total Revenue Line Chart
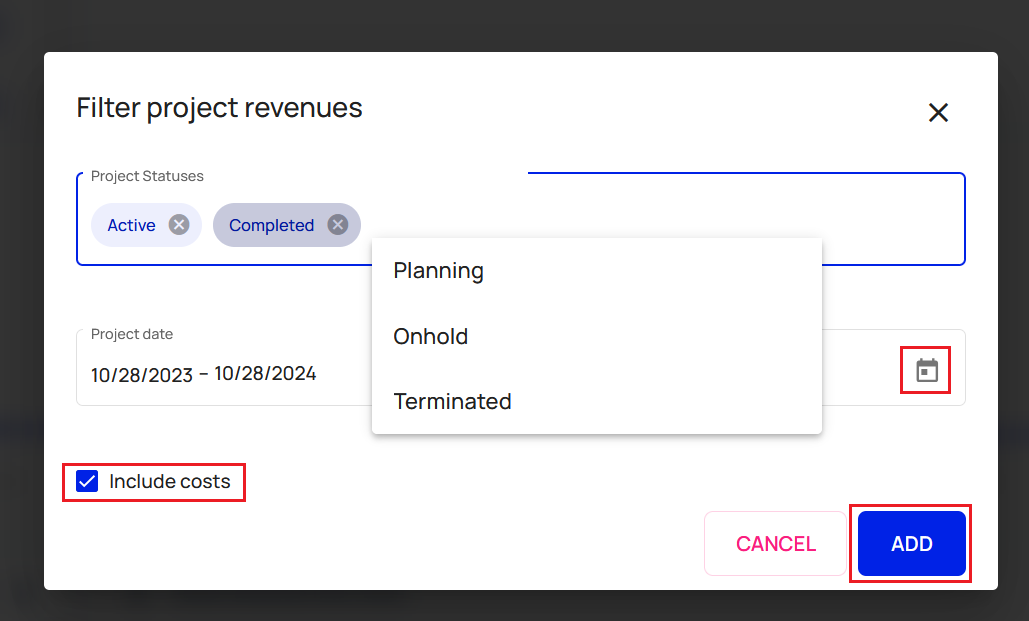
The total revenue line chart is a dynamic module in the dashboard that provides project revenues filtered by status and projects dates.
Selecting the Filter Icon will open the Filter projects revenue pop-out window, allowing you to constrain the data to specific groups and date windows.
When the filters are set as desired, selecting the Add button will refresh the chart in the module to match the selected filters.
Employee Rates
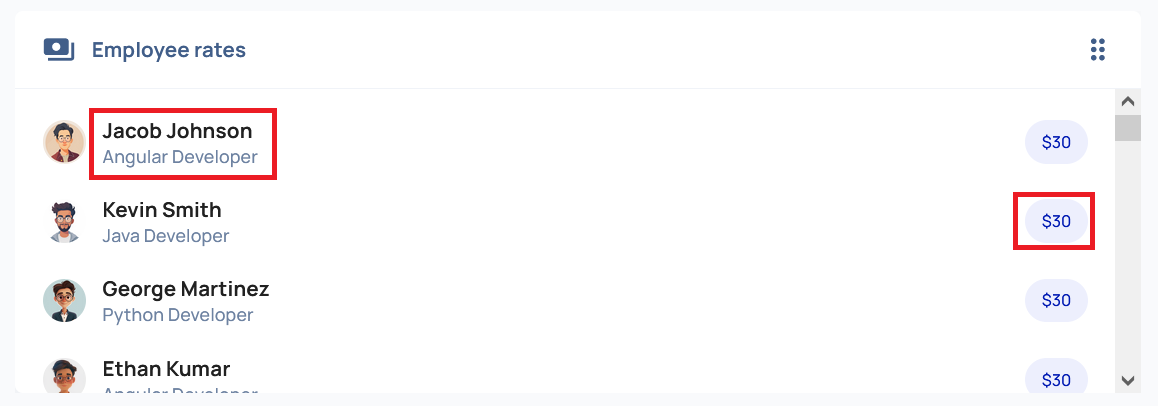
The Employee Rates module provides both insight and control into the billing rates framework for the dashboard. User profiles can be interrogated directly inside the module, and contract details can be adjusted.
Profile
Select the name of a user's profile, a preview window for that profile will populate on the right side of the screen. These profile previews include active projects, assigned roles (and their required skills), the user's current skill levels, the user's languages, as well as any courses from the education system.
The full profile can be navigated to by selecting the Profile Icon in the top right corner.
Rates
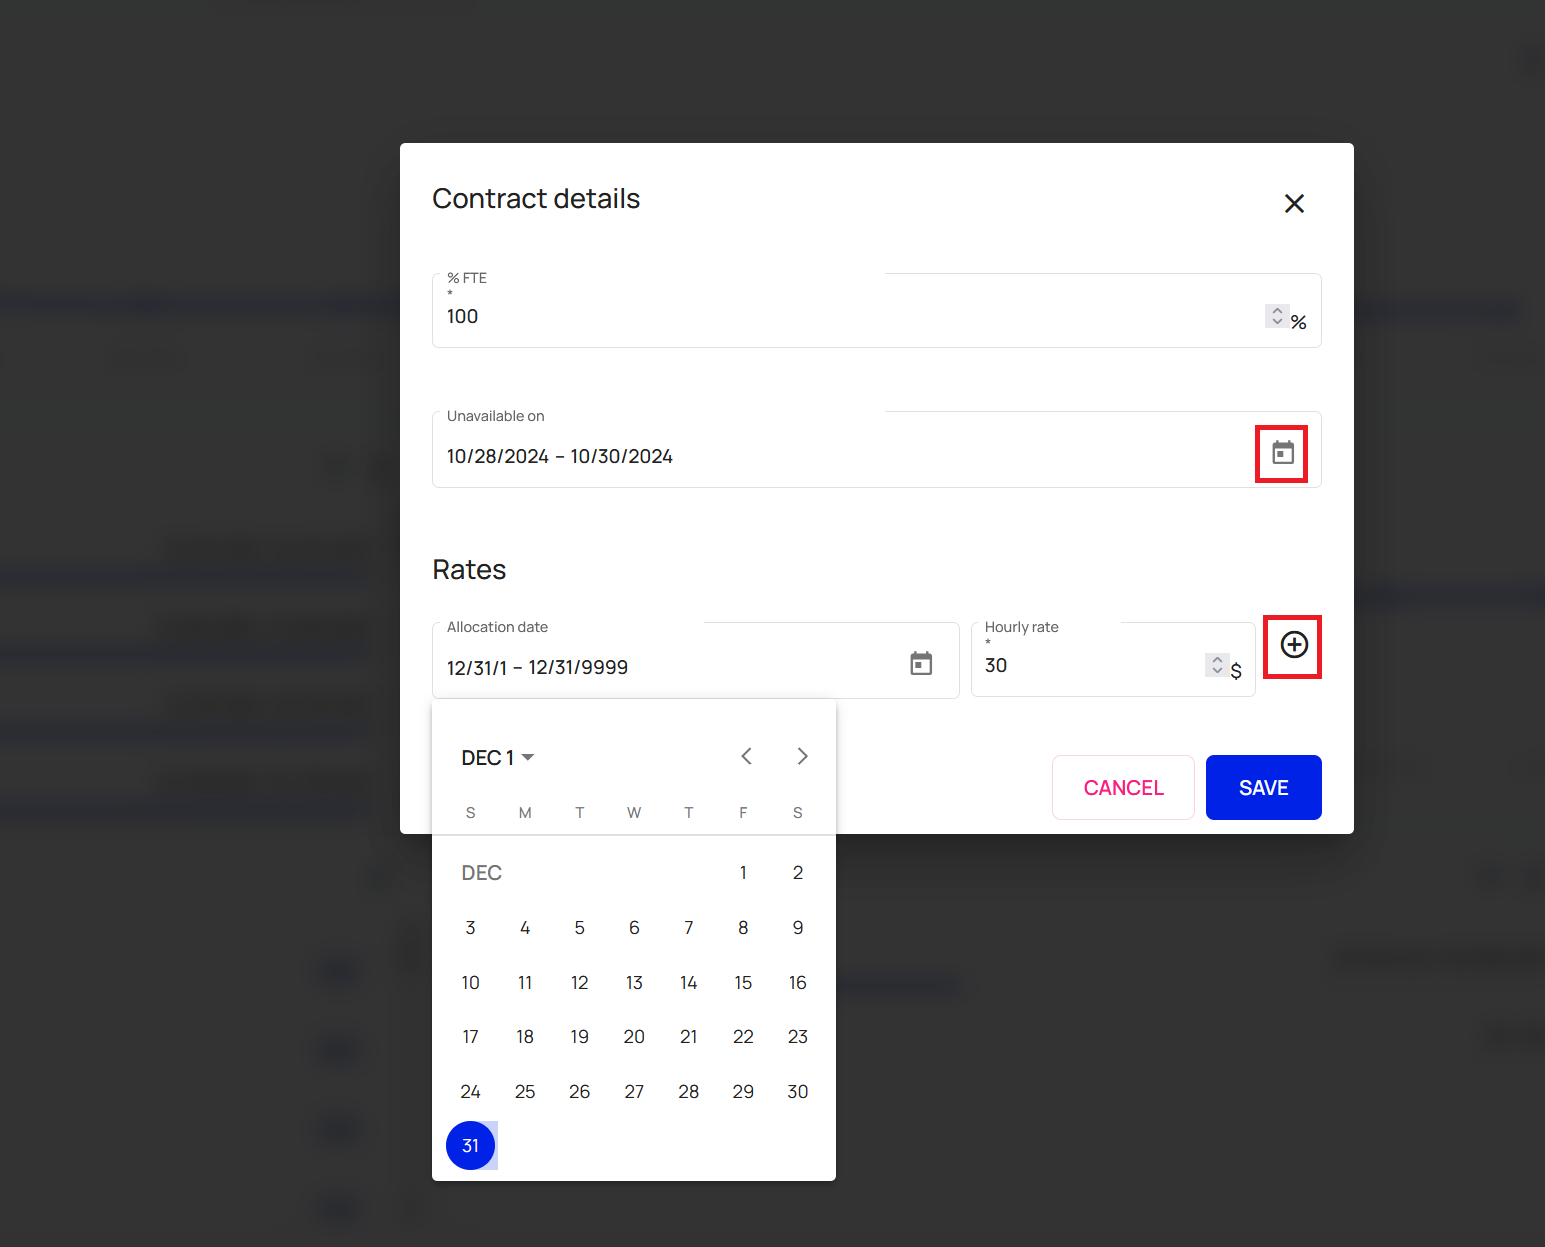
Select the employee's rate value to open up the Contract Details window for that user.
The contract details window allows you to edit the full time employement rate (%FTE) for the user (out of 100), the availability for the user, the allocation for the rate, and the hourly rate. Date windows for availability and allocation can be entered manually or by selecting the Calendar icon to open and then selecting the dates from the multi-selection calendar window. Selecting the Save button will persist the changes.
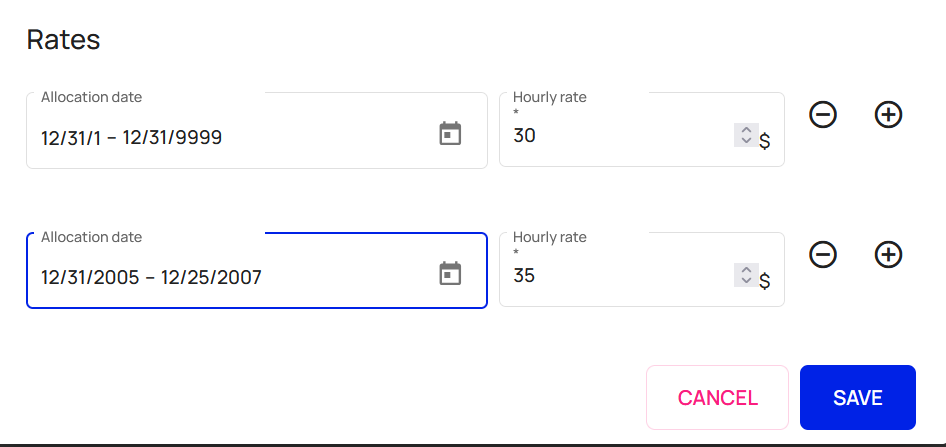
Add Allocation
By selecting the + Icon next to the allocation row, you can add additional allocations to the contract details.
Input the allocation dates and the hourly rate for the new allocation. Selecting the Save button will persist the changes.
Revenue by Labels
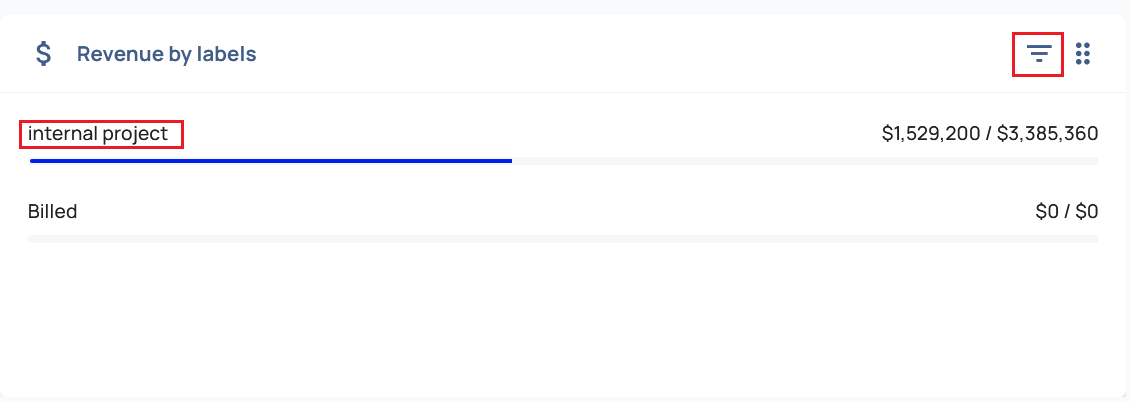
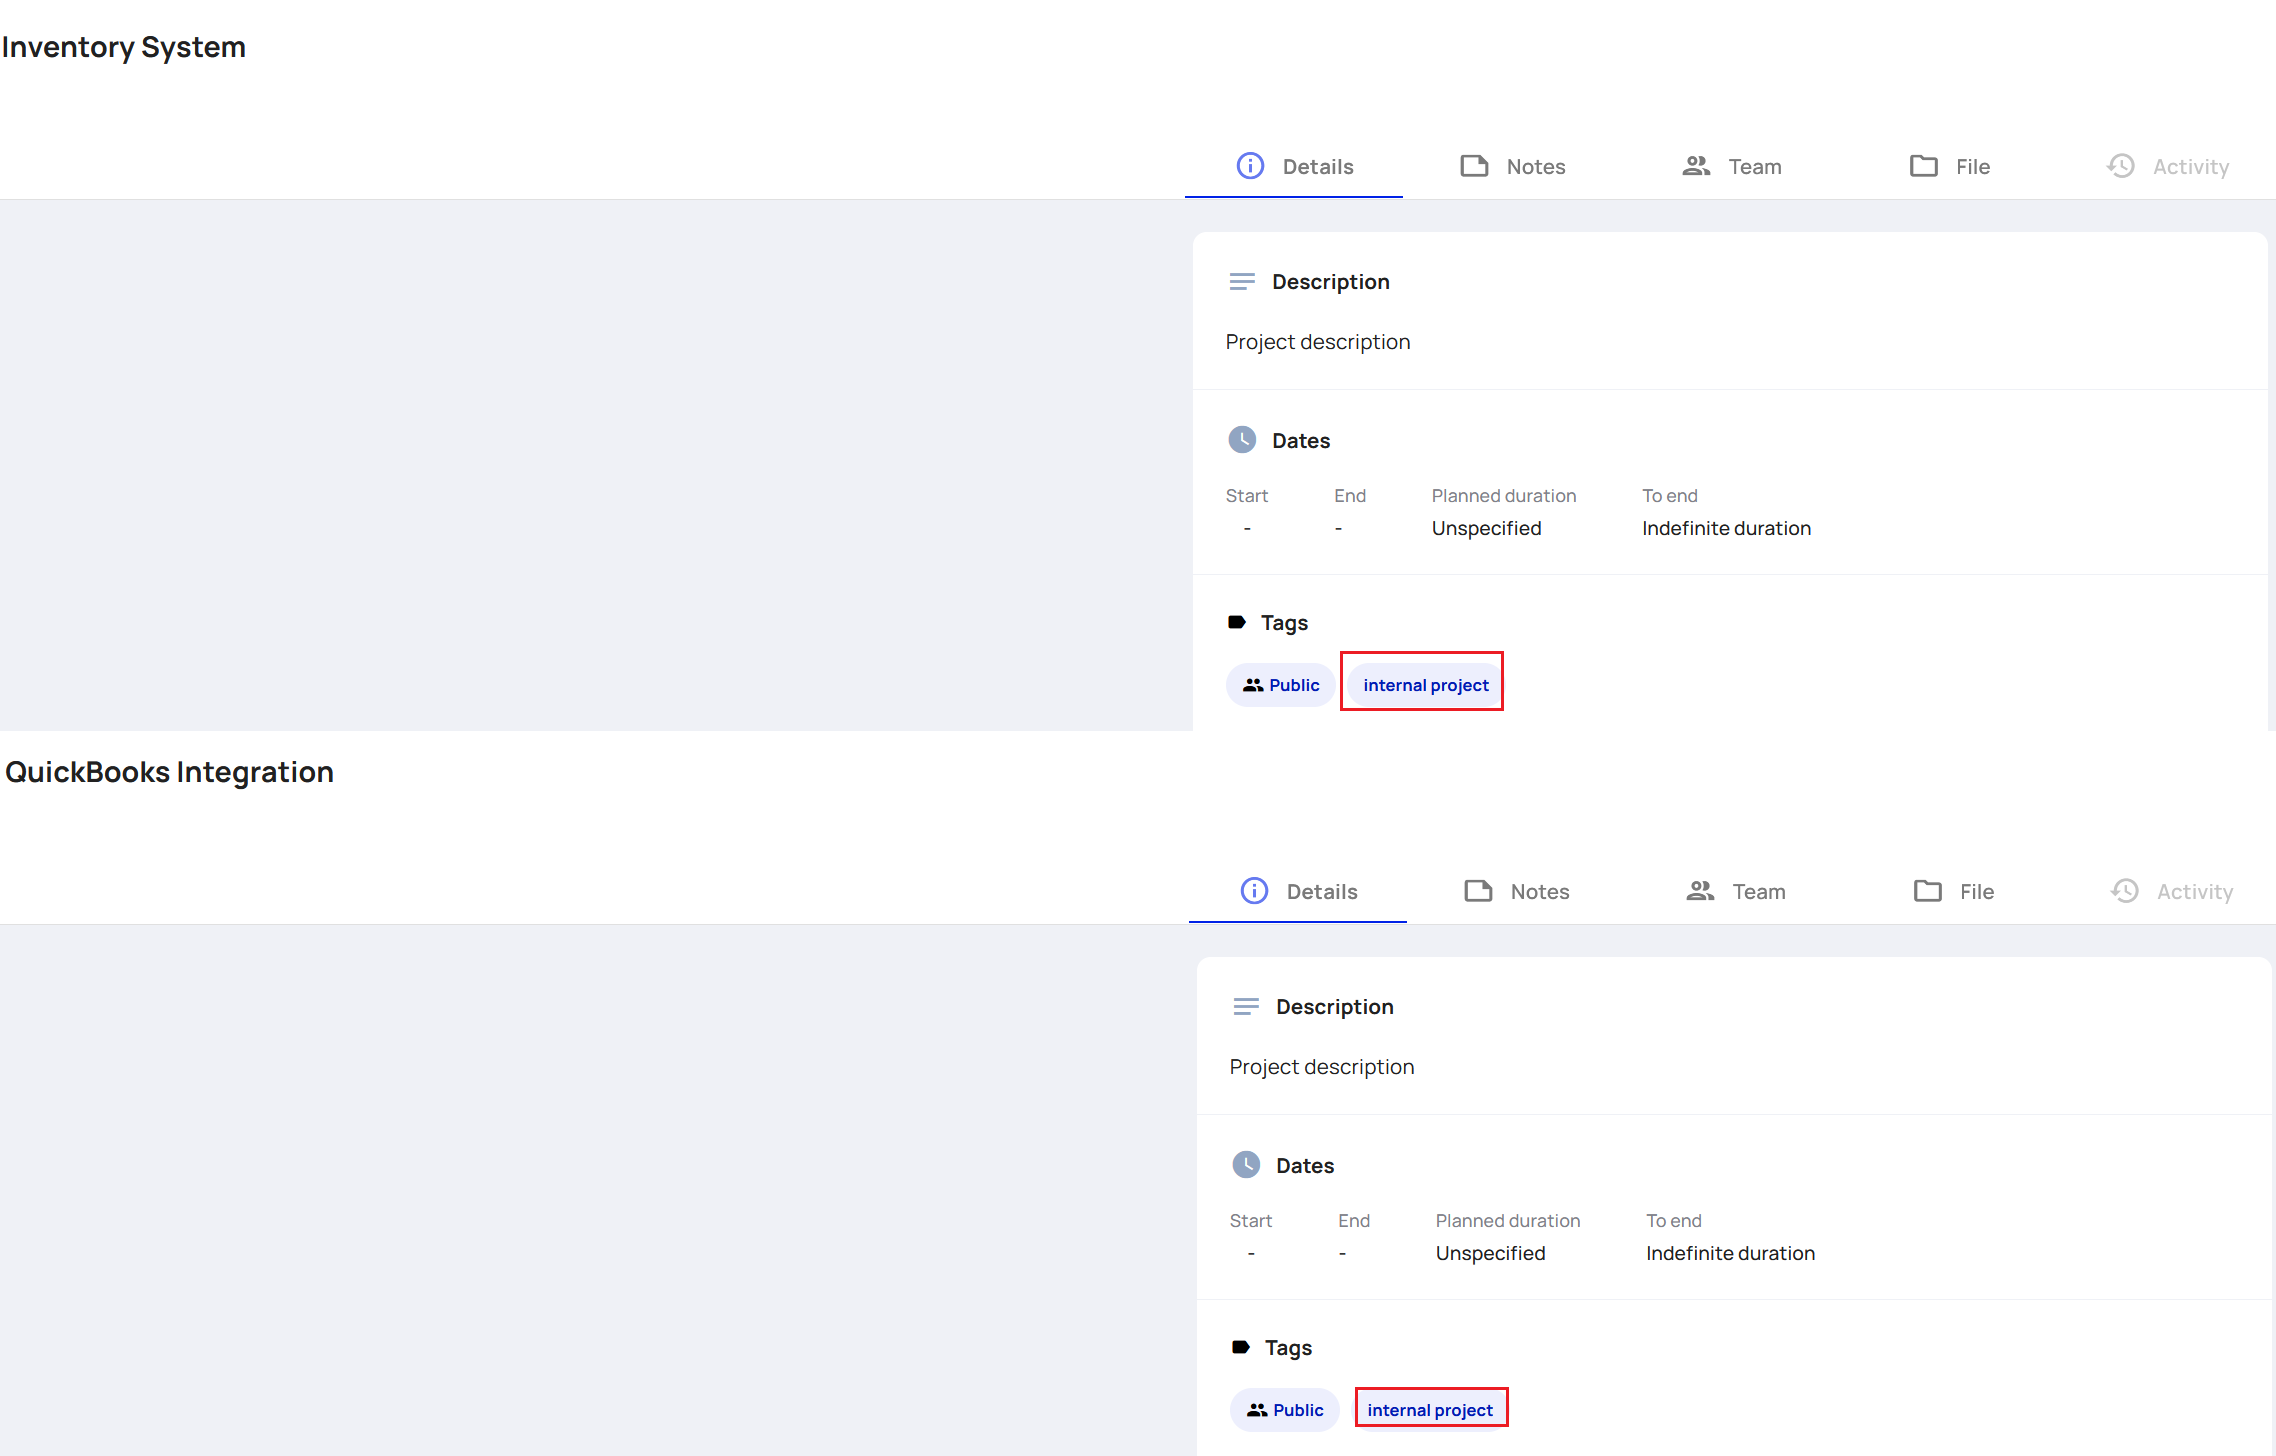
This module shows a numerical breakdown of the total revenue for projects based off the labeled tags they have individually. This module can be filtered by project status by selecting the Filter Icon. For an example of the categorization, the tag label internal project is highlighted below:
This label matches the tags for several projects, which means their revenue is being added to the total in this group.
Labels Overview
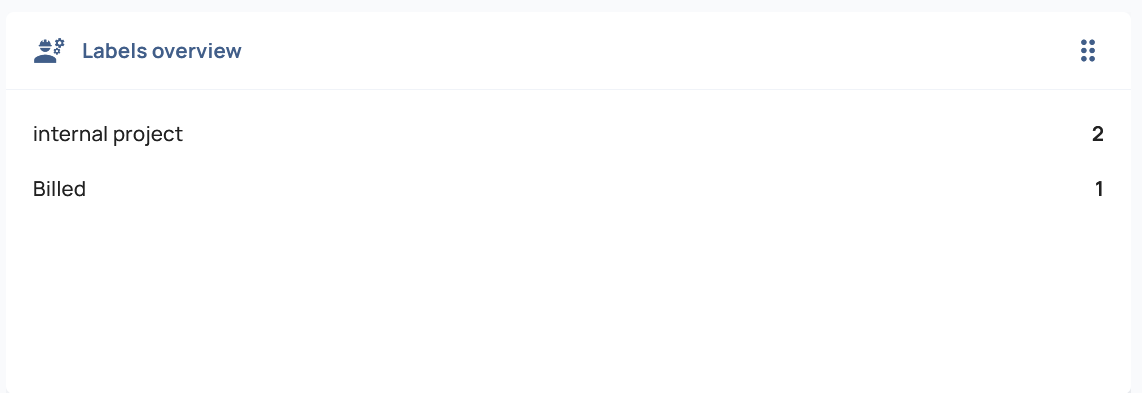
The Labels Overview module provides a numerical count of the different projects tagged with the label identified.
Editing the Dashboard
To add or remove modules from the Dashboard view, select the Edit icon at the bottom of the dashboard. This will open the editing view as well as the sidebar for modules available to be added.
Remove Modules
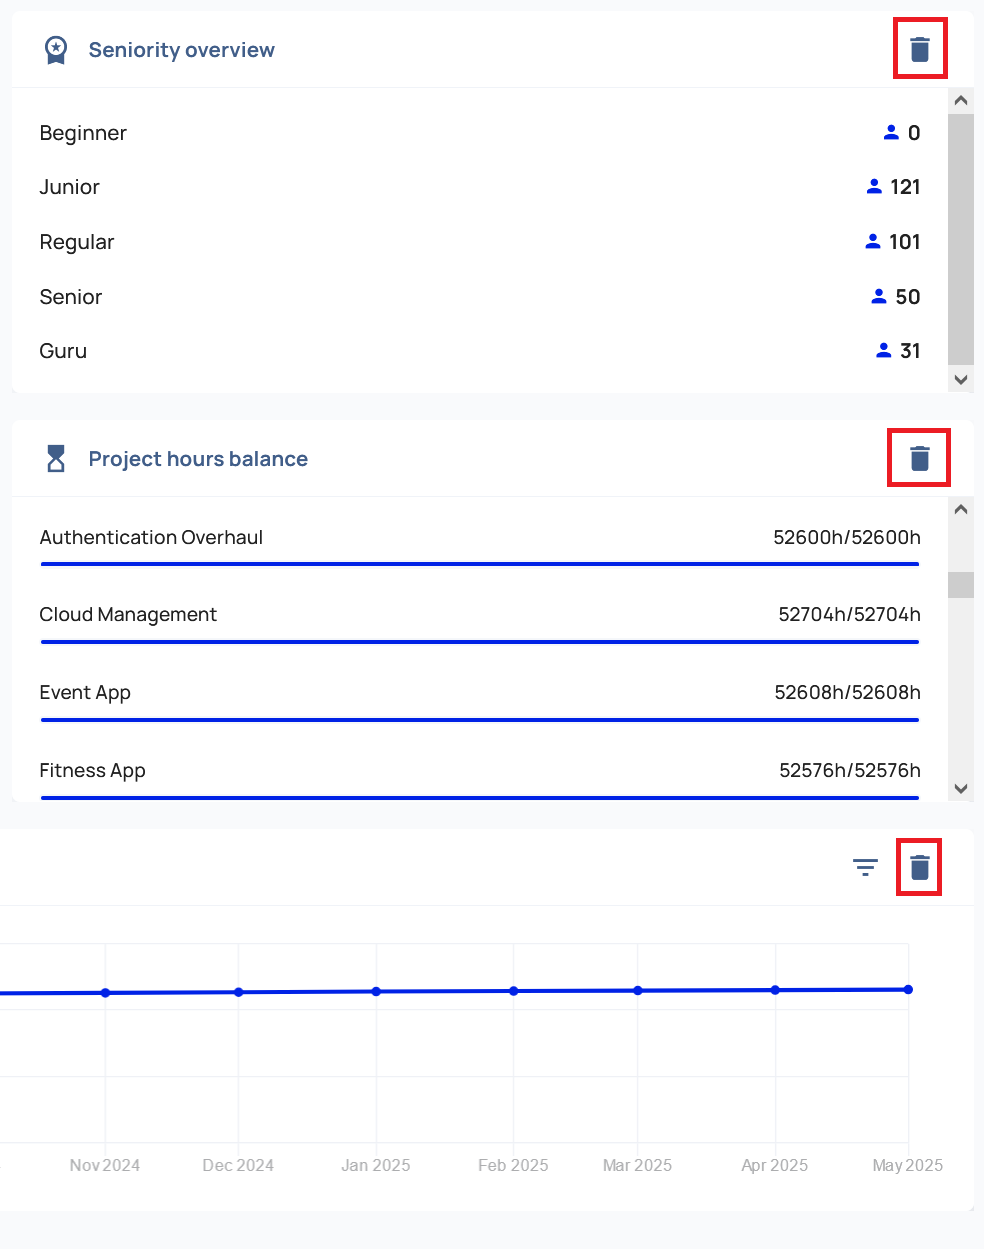
While in the editing view of the dashboard, selecting the Trash Can icon will allow you to remove the selected modules from the dashbaord view, placing them in the sidebar of available modules to be added to the view.
Add Modules
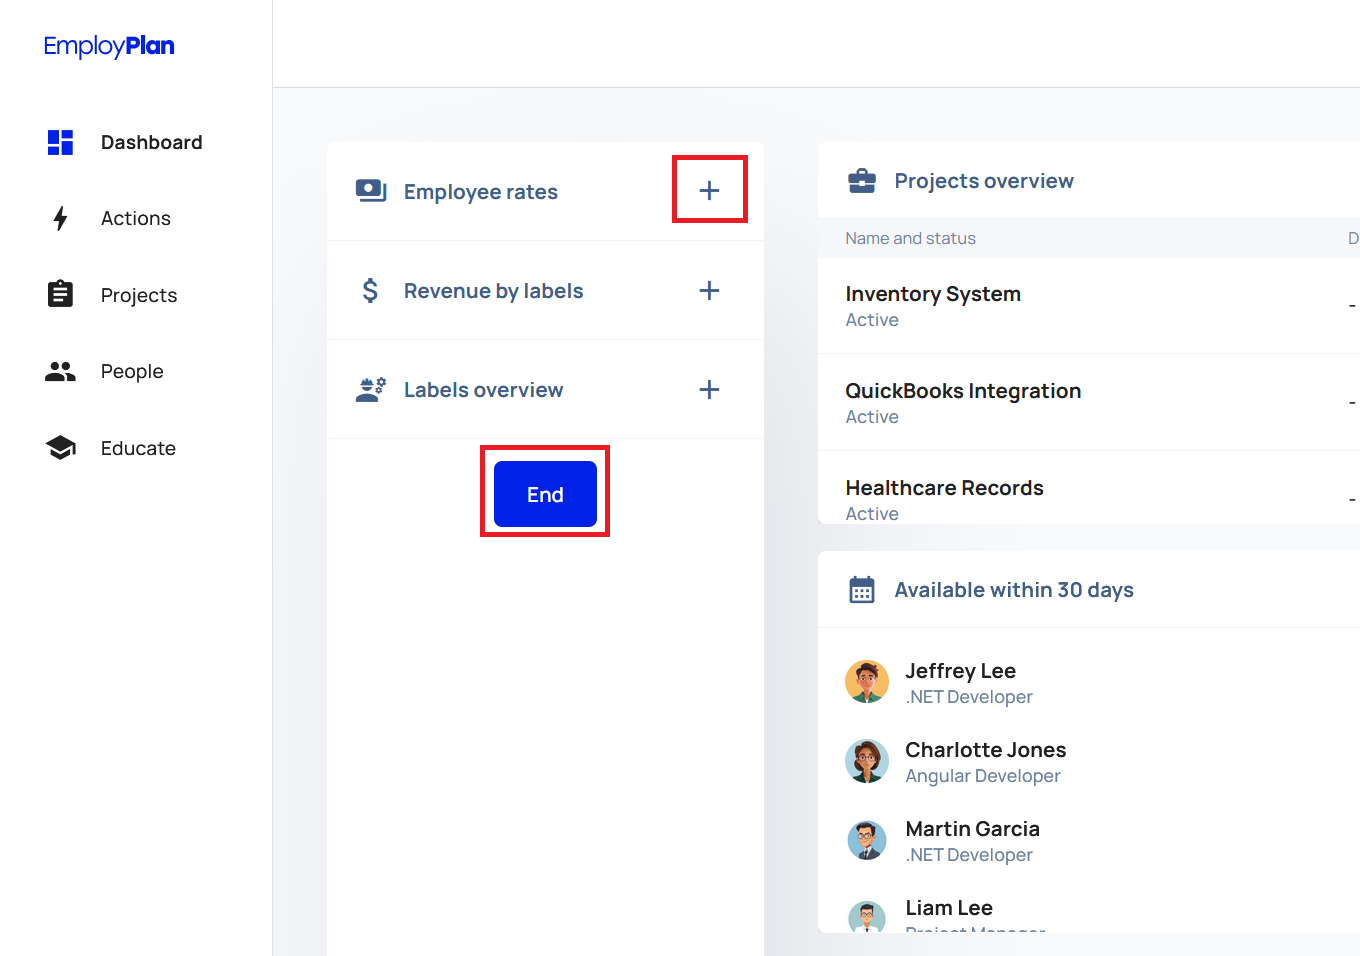
While in the editing view of the dashboard, you can add modules to the dashboard by selecting them from the available modules by selecting the + Icon next to the desired module. This will add the selected widget to the dashboard at the bottom of the layout.
When all the desired widgets have been added, selecting the End button will close the editing view of the dashboard.
Move Modules
The modules of the dashboard can be moved by clicking and holding the 6 dots icon, and then dragging the module to the desired location. When the module is being moved, it will become slightly transparent and the surrounding widgets will move dynamically to show the new potential locations. When the desired is selected, release the click-hold on the module and it will be placed in that location.


